Big Data Analytics
Big Data Analytics. By Anahita Saghafi 2012. Big Data - What? . It is about data with the following characteristics Volume Velocity Variety. Volume. 36% Average Growth of Business data each year

Big Data Analytics
E N D
Presentation Transcript
Big Data Analytics By Anahita Saghafi 2012
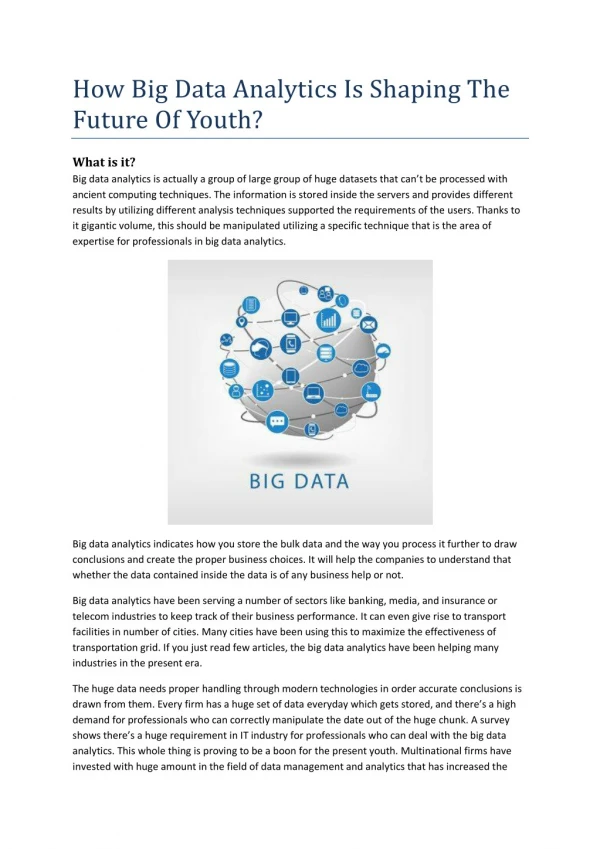
Big Data - What? • It is about data with the following characteristics • Volume • Velocity • Variety
Volume • 36% Average Growth of Business data each year • Gartner says that vendors must revamp their data warehouse platforms to deal with growing data volumes, taking advantage of new and exciting technologies, as more enterprises collect greater data volumes while demanding real time reporting and analytics.
Variety • Structured In relational databases and dimensional data warehouses – extracted from operational source systems such as ERP and CRM. • Un-structured Data in variety of formats such as text, audio, video. • Semi-structured is everything in between. Web logs in the form of XML documents, call data records from networks, statuses from components in a smart grid, GPS readings that locate a smart phone. All the formats and structures in which data arrives:
Velocity • Faster speed in which data is created/updated and streams in • Faster speed of access to the intelligence • Larger amount of new and updated data – faster than ever • 78%of Big Data companies need delivery of data within 24 hours
Who is Winning? The Aberdeen Group surveyed 247 organizations about their data practices and assessed their responses using the following criteria: • Time to Integrate New Sources • Increase in Accessible Data • Accuracy of Data • On-time Intelligence Delivery Aberdeen then ranked the organizations along the following scale • TOP 20%: Best in Class • MIDDLE 50%: Industry Average • BOTTOM 30%: Laggards
Who is Winning? • 21 days required to integrate new data sources, compared with 53 days for the Industry Average and 130 days for Laggards • 32% year over year increase in accessible business data, compared with a 16% increase for the Industry Average and 6% for Laggards • 91% of business data is considered to be accurate, compared with 80% for the Industry Average and 54% for Laggards • 92% of key business information is delivered on-time, compared with 75% for the Industry Average and 39% for Laggards • TOP 20%: Best in Class • MIDDLE 50%: Industry Average • BOTTOM 30%: Laggards
Pain Points • 69% Said: Increasing Demand for Management Information • 67% said: New analytic needs not well suited to existing data warehouse
What Works? • Executive-Level Policies Supporting Better Data Oversight • Decision Culture That Values the Use of Supporting Data • Formal In-House Development of Analytical Skill Sets • Data Quality Tools (Cleansing, Enrichment, Normalization)
How BEST IN CLASS Manage BIG DATA • Elevate Data Management Initiatives to the Executive Level. • Evaluate Data Quality Technologies. • Improve Ability to Measure Time to Information
Following the Leaders • PROCESS 61% of the Best in Class have executive-level data oversight policies. • ORGANIZATION The Best in Class are 63% more likely to value using data to support crucial decisions. • TECHNOLOGY The Best in Class are more likely to have a dedicated business intelligence platform. • KNOWLEDGE MANAGEMENT The Best in Class are 2X likelier to centralize creating, updating, and maintaining data definitions. • PERFORMANCE MANAGEMENT Top performers are 76% more likely to capture, monitor, and improve upon data quality issues
Benefit of Big Data Analytics in Retail • Gain insight about the effectiveness of specific marketing campaigns and channels • Implement cross-channel marketing campaigns • Use data analytics to better align overall marketing activities with specific sales objectives and goals • Improve the targeting of marketing offers to optimize marketing ROI (right person, right channel, right time, right message) • Align marketing activities with specific sales objectives and goals • Improve customer profitability and value by identifying cross-sell / up-sell opportunities to existing customers
Benefit of Big Data Analytics in Retail • Identify new product opportunities within our current market • Build unique customer profiles and personas in order to match solutions to specific customer needs • Implement a customer experience management (CEM) initiative • Implement a customer analytics strategy • Improve digital advertising yield • Improve the brand image of our company (i.e. build brand equity) • Optimize marketing activities at each touch-point along the customer lifecycle
Marketing Analytics • Outbound Marketing Campaigns (i.e. customer segmentation, offer targeting, etc.) • Inbound Marketing Campaigns (i.e. calls into call centre, web visit) • Customer Experience Management (CEM) (aligning customer touch points with buyer preferences / behaviour) • Brand management / market research • Web Experience Management (WEM) (e.g. Web analytics, optimization, targeting, etc.) • eCommerce merchandising (i.e. next best offer, product recommendation, cart abandonment, etc.) • Social media marketing and Social CRM
Customer Centric Analytics • Increase overall response rate of marketing campaigns / campaign optimization • Understanding customers as individuals • Gain a better understanding of conversion trends and audience behaviours • Increase accuracy of audience targeting • Marketing Mix optimization (i.e. insight about which programs truly make an incremental contribution) • Reduce churn / increase loyalty • Increase cross-sell revenue • Increase lifetime value • Gain insight for new product development
Knowledge Management Requirements • Ability to define buyer personas (based on demographic, firmographic, and / or behavioural data) for marketing campaigns and nurturing • Process to dynamically optimize / customize web content based on buyer persona / segmentation • Ability to generate customer behavioural profile based on real-time click-stream analysis • Ability to optimize marketing offers or web experience based on social activity / profile of buyer • Prospect / buyer data captured in various channels is aggregated and utilized in cross-channel marketing efforts • Process to analyse cross-channel attribution
Knowledge Management Requirements • Ability to incorporate unstructured data into analytical models • Customer behaviour is used to segment and target marketing audiences • Access to spending history of existing customers • Access to behavioural/inbound marketing data of prospective customers • Ability to capture customer sentiment data, either structured or unstructured • Customer profile is updated dynamically (real time or near-real time) based on customer activity (transactional / behavioral data)
Performance Management Requirements • Ability to measure customer profitability • Ability to incorporate campaign response / results into analytical models • Enterprise-wide metrics defined to measure success of analytical models • Ability to capture a consolidated view of all campaign-related activities • Process to measure the marginal lift from targeted campaigns • Ability to measure lifetime customer value • Use of role-based marketing analytics dashboard (views defined by role, i.e. campaign management to executive)
Traditional BI v Big Data Analytics • Traditional BI explains “What happened”. Big Data Analytics is about “What will happen” • Traditional BI uses limited data sets, and simple models. Big data analytics uses many diverse and uncorrelated raw data sets, and complex predictive models. • Traditional BI supports causation: what happened, and why do we think it happened? Big data analytics is mostly about correlation: by using multiple unrelated data sources, we've found a wonderful new insight we can't entirely explain.
Some Examples of Big Data Analytics Techniques • Bucket Testing with Big Data: What copy text, layout, images or colours will improve conversion rates of the web sites • Association Rule Learning: Use Market Basket Analysis, Data for the product bought together used to determine associations and discover interesting relationships that can be used for marketing (customers who but bright colour dresses also buy beauty products!) • Supervised Learning/Classification: Prediction on segment specific customer behaviour such as buying decisions and consumption rate, using existing big data. • Data Fusion and Integration: Social Media Analysis using Natural Language Processing, combined with real-time sales data to determine what effect a marketing campaign has on customer sentiment and purchasing behaviour. • Neural Network: Algorithms that could be used to identify high value customers that are at risk of leaving or identifying fraud • Network Analysis: Techniques to use network data to identify the flow od data. Can be used for marketing by finding the influencers and bottlenecks