Download
1 / 24
240 likes | 398 Vues
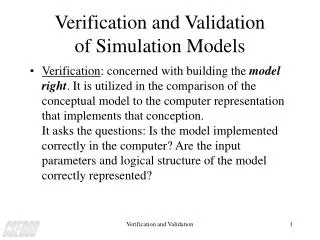
Verification of wave forecast models. Martin Holt Jim Gunson Damian Holmes-Bell. Verification. Models are verified against in-situ observations. Observations from moored buoys and platforms: wave height, wind speed, wave period.

E N D
Verification of wave forecast models Martin HoltJim Gunson Damian Holmes-Bell
Verification • Models are verified against in-situ observations. • Observations from moored buoys and platforms: wave height, wind speed, wave period. • Observations from satellites: wave height, wind speed, wave energy spectrum • Monthly performance statistics are produced and monitored. • International collaboration to validate ERS-2 and Envisat missions.
Global wave model verification exchange • Started 1995 • Met Office, ECMWF, NCEP, FNMOC, Canada, Meteo-France • Each centre co-locates model and moored buoy data in agreed format and exchanges monthly by ftp. • Datasets collated and statistics prepared • Published results: Bidlot, Holmes, Wittmann, Lalbeharry, Chen 2002, Weather and Forecasting 17
Global wave model verification exchange timeseries wave height bias December 1996 to December 2002
Global wave model verification exchange timeseries peak period bias December 1996 to December 2002
Global wave model verification exchange timeseries wind speed bias December 1996 to December 2002
Global wave model verification exchange February 2003 Bias through 5 day forecast (top) Hs (middle) windspeed (lower) peak period
Global wave model verification exchange February 2003 SD through 5 day forecast (top) Hs (middle) windspeed (lower) peak period
Satellite radar altimeter • ERS-2 (and now Envisat) • Co-located wave height & wind speed • 1 observation per second =7km • use a 9 second average (for approx 60km interval) or 20 second average for assimilation • needs careful quality control • buddy check • background check • climatology check
Satellite Altimetersalong-track wave height ERS-2 23 January 2003 Track crossing central South Pacific Some outliers are close to land Envisat
Satellite Altimeter ENVISAT RA-2 Ku Wave height March 2003 all data before quality control. Red indicates rain flag set black crosses show mean value in bin
Satellite Synthetic Aperture Radar • 5km x 5km vignettes taken every 200km ERS-2 (every 100 km Envisat) • Values at 12 wavelengths(100m - 1000m) • and 12 directions in half-plane. • Directional ambiguity • Nonlinear transformation from wave energy spectrum from SAR product Processing • Software developed at DLR (Susanne Lehner, Johannes Schulz-Stellenfleth) and the Met Office to perform inversion. • Azimuthal cutoff wave model supplies info • Compare modelled spectra with retrieved spectra
Comparison of modelled spectra with SARexample 12 hours data compare Hs Model co-locations in time at 30 minute intervals observed
Comparison of modelled spectra with SARexample 12 hours data compare Hs for 18 second waves Demonstrates need for improved observation retrieval at longer wave periods
Comparison of modelled spectra with SARexample 12 hours data compare Hs for waves of 10 second period
Comparison of modelled spectra with ERS-2 SAR Pacific Swell example 6.68N 122W top left: SAR data top right model wave energy spectrum bottom left: retrieved SAR wave energy spectrum bottom right comparison 1d spectra (black model red SAR)
Comparison of modelled spectra with ERS-2 SAR Windsea example 48S 30W top left: SAR data top right model wave energy spectrum bottom left: retrieved SAR wave energy spectrum bottom right comparison 1d spectra (black model red SAR) Hs 4.62m model 3.13m SAR
Comparison of modelled spectra with ERS-2 SAR Windsea example 66S 91W top left: SAR data top right model wave energy spectrum bottom left: retrieved SAR wave energy spectrum bottom right comparison 1d spectra (black model red SAR) Hs 5.85m model 6.75m SAR
SUMMARY • For global and regional wave models, validation is carried out against instrumented moored buoy observations of wave height, wave period and windspeed. • Validation against altimeter data requires careful quality control when used in near-real time. • Validation against satellite retrieved wave spectra needs further development of the retrieval scheme
Observing waves with SAR Synthetic Aperture Radar Flown on ERS-2, archived daily
The SAR observation • Bragg scattering of microwaves • Two-scale model of ocean surface: • ripples and long waves • Doppler effect used to resolve features Hydrodynamic modulation Tilt modulation