Download
1 / 33
330 likes | 370 Vues
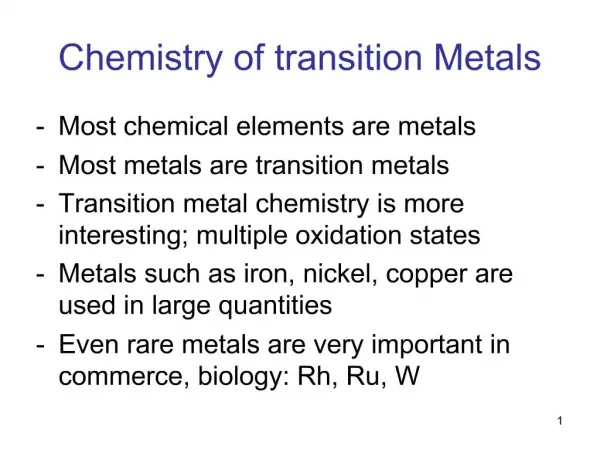
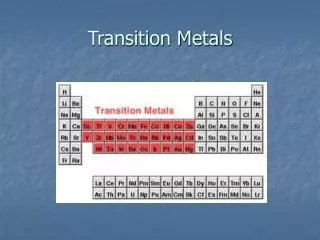
Understand the complexities of transition metals, ionization energies, oxidation states, and color changes in coordination complexes. Dive into ligand bonding, crystal field splitting, and spectrochemical series.

E N D
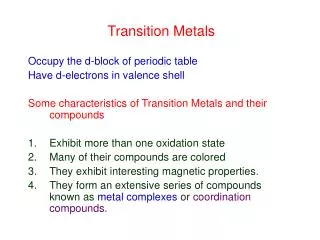
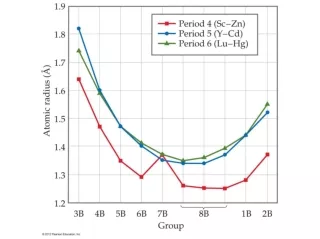
First Ionization Energies of Transition Metals • The first ionization energy increases gradually from left to right on the periodic table. 5d 3d 4d
Formation of Coordinate Covalent Bonds • A ligand donates a lone pair of electrons to form a bond to a metal. • Ex. The Ni–N bonds in [Ni(NH3)6]2+ form by overlap of the lone pair sp3 orbital on the nitrogen atom with an empty valence orbital on the metal. Donor Metal
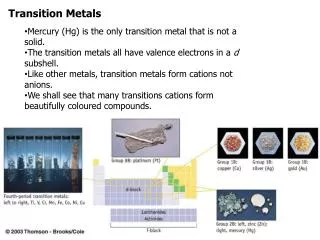
Two Ni2+-Ligand Complexes • Both water and ammonia form six covalent bonds with Ni2+, resulting in octahedral geometry.
Colors of Two Ni2+-Ligand Complexes [Ni(H2O)6]2+ [Ni(NH3)6]2+
Coordination Number - Two • Complexes with coordination number two always adopt linear geometry about the metal cation.
Coordination Number – Four Tetrahedral and Square planar
Coordination Number – Six Octahedral
Heme Iron • Oxygen-carrying component of blood. • Planar structure. • Multi-ring structure of C and N atoms. • Extensive delocalized π system. • Binds one Fe2+ cation at its center.
Repulsion of Ligand Electrons and Metal Electrons is Greatest with Overlap • dx2–y2 points directly toward the ligands. • Overlap results in increased repulsion. • dxy points between the ligands. • Lack of overlap results in less repulsion. y y x x dxyorbital dx2–y2 orbital
The Five d Orbitals Interacting with an Octahedral Set of Ligands
The Crystal Field Level Diagram for Octahedral Coordination Complexes • Electron-cation attraction stabilized all five d orbitals. • Electron-electron repulsion destabilizes the five d orbitals by different amounts.
Crystal Field Splitting Energy • Crystal field splitting energy: • The difference in energy between the eg and t2g sets. • Symbolized by the Greek letter, Δ. eg dz2 dx2–y2 Δ t2g dxy dxz dyz
The Spectrochemical Series • The spectrochemical series lists the common ligands in order of increasing ability to split the energies of the t2g and eg subsets of orbitals. • The ranking of ligands is influenced most strongly by the donor atom: • Generally decreases across Row 2 of the periodic table. • Generally decreases down the halogen column. • Molecular orbital theory is best used to explain the trend.
Relationships Among Wavelength, Color, and Crystal Field Splitting Energy (Δ)
Colors of Cr3+ Coordination Complexes • The colors of Cr3+ coordination complexes depend on the magnitude of the crystal field splitting energy. • Higher Δ, shorter λ. • The spectrochemical series indicates the relative magnitude of Δ.