Download
1 / 18
180 likes | 355 Vues
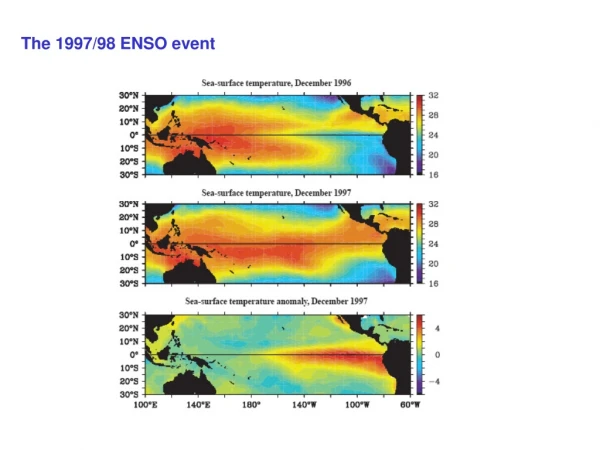
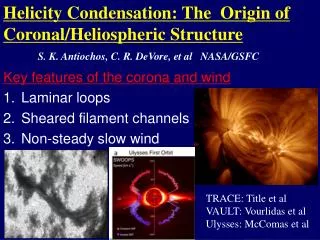
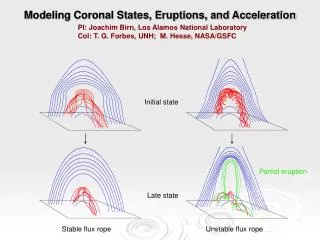
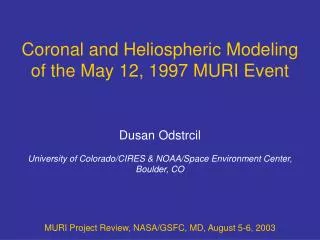
Coronal and Heliospheric Modeling of the May 12, 1997 MURI Event. Dusan Odstrcil University of Colorado/CIRES & NOAA/Space Environment Center, Boulder, CO. MURI Project Review, NASA/GSFC, MD, August 5-6, 2003. Solar Wind Parameters.

E N D
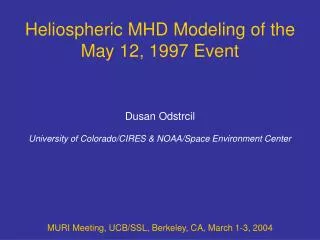
Coronal and Heliospheric Modeling of the May 12, 1997 MURI Event Dusan Odstrcil University of Colorado/CIRES & NOAA/Space Environment Center, Boulder, CO MURI Project Review, NASA/GSFC, MD, August 5-6, 2003
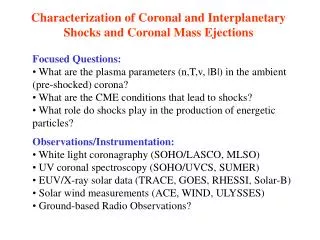
Solar Wind Parameters Large variations in plasma parameters between the Sun and Earth Different regions involve different processes and phenomena We distinguish between the coronal and heliospheric regions with an interface located in the super-critical flow region (usually 18-30 Rs)
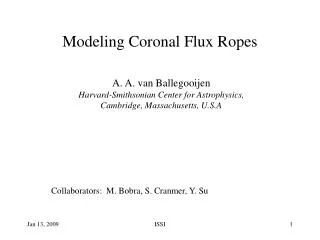
Photospheric magnetic field (NSO Kitt Peak) Halo-CME (SOHO/LASCO) Modeling of Heliospheric Events Coronal model (SAIC, semi-empirical) CME cone model (Zhao et al.) Source-surface maps at 30 Rs Geometrical and kinematical data Time-dependent boundary values (N, T, V, B) Heliospheric model (ENLIL, 3-D MHD solar wind)
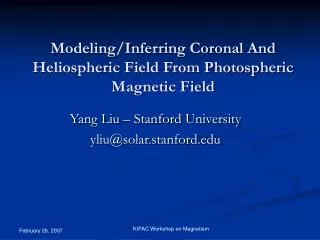
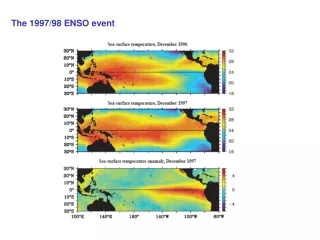
Global Solar and Coronal Observations Remote solar observations of the photospheric magnetic field Remote coronal observations of the white-light scattered on density structures
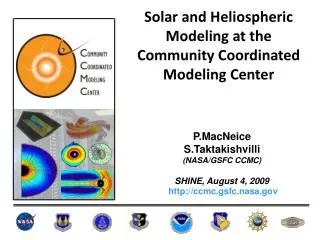
Ambient Solar Wind Models CU/CIRES-NOAA/SEC 3-D solar wind model based on potential and current-sheet source surface empirical models [Arge, Mayer, Pizzo] SAIC 3-D MHD steady state coronal model based on photospheric field maps [Linker, Mikic, Riley] UCB 3-D MHD steady state coronal model based on photospheric field maps [Ledvina, Luhmann]
CME Cone Model Best fitting for May 12, 1997 halo CME • latitude: N3.0 • longitude: W1.0 • angular width: 50 deg • velocity:650 km/s at 24 Rs (14:15 UT) • acceleration: 18.5 m/s2 [ Zhao et al., 2001 ]
CASE - 1 Boundary Conditions CASE - 2 Ambient Solar Wind + Plasma Cloud Ambient Solar Wind
CASE - 1 Evolution of Parameters at Earth CASE - 2 Ambient Solar Wind + Plasma Cloud Ambient Solar Wind
Latitudinal Distortion of ICME Shape ICME propagates into bi-modal solar wind
Radial Compression of ICME Structure Fast stream follows the ICME
Radial Compression of ICME Structure ICME propagates into the enhanced density of a streamer belt flow
Total Brightness Running Difference Synthetic White-Light Imaging ICME transforms its appearance from a halo-like shell to a distorted one with two bright spots (see right panel) Larger time-interval between two images are needed to capture expanding interplanetary transients
Appearance of Transient Density Structure IPS observations detect interplanetary transients that sometime show two enhanced spots instead of a halo ring [Tokumaru et al., 2003] MHD simulation shows a dynamic interaction between the ICME and ambient solar wind that: (1) forms an arc-like density structure; and (2) results in two brighter spots in synthetic images
Early time Later time Propagation of Energetic Particles IMF line connected to Earth by-passes the shock structure => Interplanetary CME-driven shock cannot generate energetic particles observed at Earth IMF line connected to Earth passes through the shock structure => Quasi-perpendicular shock can generate energetic particles under certain circumstances
Global view Detailed view Energetic Particles & Radio Emission Important effect occurs away from the Sun-Earth line Enhanced shock interaction together with quasi-perpendicular propagation relative to IMF lines favors particle acceleration and generation of radio emission
Near-Earth Observations Interplanetary magnetic field is distorted by: shock compression, field line draping around ejecta, and stretching in rarefaction region Internal magnetic structure (flux rope) is not included
Analytic flux-rope models (Vandas) Event-driven coronal models (Ledvina) Examples of Ongoing Work Graphical user-interface tools (Markel) Coupling with SEP, IPS, & SMEI (Jackson, Ledvina, Lee, Vandas)
Conclusions:Modeling of Interplanetary Events • It is now possible to: - simulate ambient solar wind structure; - estimate arrival of shock and ejecta; - provide a global context. • It is not yet possible to: - reproduce the internal magnetic structure of interplanetary CMEs (due to lack of coronal magnetic field observations). • Next steps: - initialization from photospheric observations; - multi-point, multi-perspective advanced observations; - framework for modeling, visualization, and analysis; - validation studies.