Download
1 / 63
630 likes | 750 Vues
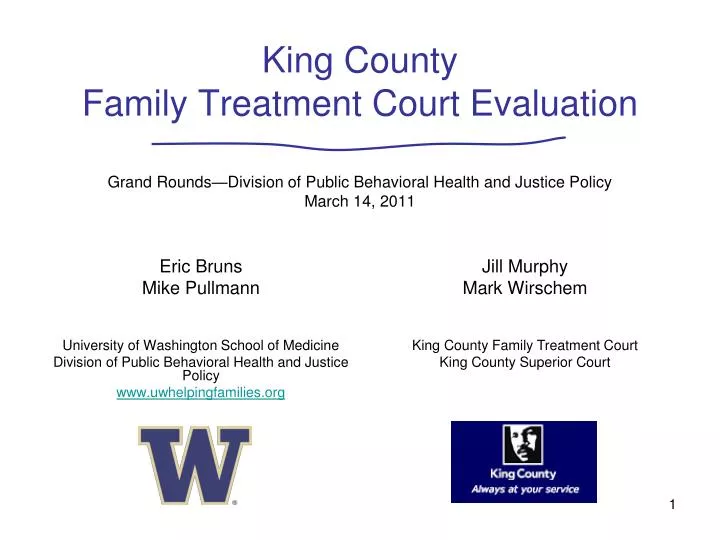
King County Family Treatment Court Evaluation Grand Rounds—Division of Public Behavioral Health and Justice Policy March 14, 2011. Jill Murphy Mark Wirschem King County Family Treatment Court King County Superior Court. Eric Bruns Mike Pullmann University of Washington School of Medicine

E N D
King County Family Treatment Court EvaluationGrand Rounds—Division of Public Behavioral Health and Justice PolicyMarch 14, 2011 Jill Murphy Mark Wirschem King County Family Treatment Court King County Superior Court Eric Bruns Mike Pullmann University of Washington School of Medicine Division of Public Behavioral Health and Justice Policy www.uwhelpingfamilies.org
Specialty and Therapeutic Courts • Problem-solving courts that aim to address the root causes of criminal activity • Generally multi-system, coordinated, collaborative process which balances supervision with support • “Therapeutic Jurisprudence Theory” (Wexler & Winich, 1991): using social science to inform legal policy and practice in order to promote individual and societal well-being. • Examples include: • Adult and juvenile drug treatment courts; • Family drug treatment courts; • Mental health courts; • Homelessness courts; • Prostitution prevention courts; • DUI courts; • Habitual offender courts; • Prison re-entry courts.
The King County Family Treatment Court • KCFTC PROCESSES AND FUNCTIONS • Comprehensive SB Assessment • High quality, appropriate CD Services • Timely/effective MH and other services • Effective care planning and management • Expanded and more frequent visitation • Consistent, timely incentives & sanctions • Random UA Screens • Effective pre-hearing case conferences • Effective judicial interaction • SHORT-TERM OUTCOMES • Eligibility/enrollment completed quickly • Enrollment in appropriate CD services • Parents compliant with/complete treatment • Parents ultimately able to remain sober • Parents/children more fully engaged in svcs • Parents/children receive needed services • Decreased placement disruptions • Parents compliant with court orders • Less negative effect on child well-being • Less disruption of child-parent bonds • Increased family reunification rates • Earlier determination. of alternate placement options • NATIONAL BEST PRACTICES • Communication bw Court and providers • Judge plays active role in Tx process • Judge responds to positive & noncompliant beh. • Mechanisms for shared decision making • Accountability for Tx services • Strategy for responding to noncompliance • MIS allow data to be assembled/reviewed • Enhancement of due process • Team members provided adeq resources
Petition Exit System Dismissed Petition Petition Petition Petition Petition Dismissed Dismissed Dismissed Dismissed Dismissed Enter FTC* (See separate flow chart) Shelter Care 30 - Day Shelter Pre - Trial Fact - Finding Disposition Shelter Care Hearing Placement in Dependency Case Conf . Care Review Conference Hearing Petition Hearing ( w / in 72 hours of place - Shelter Care Petition Filed Approved ( w / in 30 days of ment or filing , whichever ( 30 days prior to ( 21 days prior to ( w / in 75 days ( same day as or w / in 14 occurs first ) placement ) fact - finding ) of filing ) days of dep finding ) fact - finding ) Dependency Stipulated Dept . Review Hearing Child supervision ( the sooner of 90 days returned continues for from Dispo . or 6 mos . Exit FTC w/o Permanency Goal Achieved home from date of placement ) 6 mos . Dependency Continued Review *There can be entry into FTC anytime after dependency is established as long as a referral is made to FTC within 6 months of the filed petition date. Permanency Hearing Planning Hearing ( 12 months from date of placement & every 12 months thereafter ) Permanency Yes Goal Achieved ? No Petition for Yes Parental Rights Termination ? No Review Hearing ( w / in 6 months after permanency planning hearing ) Petition for Petition for Termination of Permanency Yes Parental Rights No Yes Parental Rights Goal Achieved ? Termination ? Filed Original Chart prepared by Michael Curtis on January 12, 2006 No Juvenile Dependency Case Flow (noting FTC)
Other FTC Hearings: Check In Hearing: Set for following week after positive/missed UA or noncompliance w/ tx Compliance Clock Hearing: Can be applied after 5th response and set 60 days out from current hearing Motion Hearing: Can be set anytime there is a contested issue. Not heard duringregular FTC calendar Box Color Legend: Red: Not a hearing Green: Beginning and end of FTC Process Blue: FTC Review Hearings Graduated Blue: Does not occur on every case Orange: Not unique to FTC Purple: Unique to FTC and can occur throughout FTC process Discharge/Opt Out Hearing: Dependency dismissed or discharged to regulardependency FAMILY TREATMENT COURT CASE PROCESSING FLOW CHART
Summary of the FTDC Literature(ca. 2008) • Now three studies of FTDC model (Green et al., Boles, NPC Research) • All three studies show positive outcomes: • Less reliance on foster care • Greater reunification rates (e.g., 42% vs. 27%; 70% vs. 45%) • Higher rates of treatment engagement and completion • No study found between-group differences in future abuse/neglect reports • NPC Research, the most active evaluators of FTCs and drug treatment courts, has completed several cost-benefit analyses at sites across the nation. The table below summarizes their findings:
Components of the KCFTC Evaluation • Process evaluation • Interviews with team members and stakeholders, 2006 and 2008 • Parent interviews, 2007-2009 • Outcomes evaluation • Analysis of child placement data from Children’s Administration and adult treatment data from the Division of Behavioral Health and Recovery • Cost-benefit analysis • Currently underway
What we learned from process evaluation • Strengths • Strong opinions about the positive impact of KCFTC • Most processes and functions viewed as successfully being accomplished by 2008 • Relative Weaknesses • Respondents less confident that goal of serving a representative population was being met • Respondents believed client load was less than optimal (serving too few families) • Mixed opinions on the amount of shared vision among team members • Certain processes and functions: • Efficiency of eligibility determination and intake • Consistency and effectiveness of incentives and sanctions • Resources and training for KCFTC staff and team members
2006: Mean= 5 Std. Dev= 1.4 2008: Mean= 5.47 Std. Dev= 1.36
Summary of Process and Function QuestionsMeans A little bit successful Somewhat Successful Moderately successful Extremely successful
Summary of Outcome QuestionsMeans About the same A little bit more successful Somewhat more successful A good deal more successful
What we learned from parent interviews • High overall satisfaction with the process • Overall perception that court process and treatment services are helpful • Some confusion among parents about requirements of court, completing treatment plan, and regaining custody • Parents of color more likely to voice confusion • Certain types of needed services to be available were difficult to access • Housing, child care, employment
Treatment Program is Helpful(n=28)“This treatment program can really help you.” Mean= 3.68 Std. Dev= .670
Court System Helps with Recovery (n=28)“There are people involved in the court system who help me in my recovery.” Mean= 3.61 Std. Dev= .685
In the past 30 days, have you needed any of the following services?If yes, did you obtain the service?If service was obtained, how helpful was it?1=Not at all helpful -- 2=A little helpful -- 3=Somewhat helpful -- 4=Very helpful --5=Extremely helpful Needed Received
Clear Understanding About Regaining Custody (n=23)“I have a clear understanding about what I need to do to have my child[ren] returned to me.” Mean= 3.22 Std. Dev= 1.043
Confused About What is Happening with my Child (n=26)“I am confused about what is happening with my child[ren].” Mean= 2.00 Std. Dev= .894
Outcome Evaluation:Research Questions • Do FTC participants have more positive substance abuse treatment outcomes than comparable non-FTC parents? • Do FTC families have more positive child welfare outcomes compared to comparable non-FTC families? • Do families of color have outcomes similar to families not of color?
Outcome Evaluation • Administrative data: • Treatment data from Division of Behavioral Health and Recovery • Child welfare data from Children’s Administration • Data collected September 2010 • Family Treatment Court group: • Selected all parents admitted to the FTC between March 2006 and October 2009 • Comparison group: • Eligible parents referred but not admitted to the Family Treatment Court • Randomly selected a reasonable number • Statistically matched on demographics, historical treatment use, and historical child welfare referrals
Detail: specific race/ethnicity Parent demographics • Mean # of children per participant • Comparison=1.39 • KCFTC = 1.46 • Parent mean age • Comparison = 31 • KCFTC = 31 • Total # of parents = 268 • Comparison = 182 • KCFTC = 76 Note: no significant differences
Prior Investigations Note: No statistically significant differences
Child demographics • Child Mean Age • Comparison = 4.2 • KCFTC = 3.5 • Number of children • Comparison = 235 • KCFTC = 89 Note: Statistically significant difference for Native American
Note on Analytic Approach… • 1). “Intent to treat” • All parents who were admitted to FTC were included in all analyses, even if they opted out or had an unsuccessful outcome. • No parent who was ever in FTC was ever included in the comparison group • 2). Index Petition Date • “Time Zero” or comparable start point for both groups was the petition date, not date of entry into FTC (comparison group had no date of entry) These decisions likely result in more conservative findings
Question 1: Do FTC participants have more positive substance abuse treatment outcomes than comparable non-FTC parents? • Are they more likely to enter treatment? • Do they enter treatment more quickly? • Are they more likely to attend treatment? • Do they remain in treatment longer? • Are they more likely to be successfully discharged from treatment?
FTC parents are more likely to enter treatment FTC parents were 63% more likely to be admitted to treatment. Note: All differences statistically significant
FTC parents enter treatment twice as fast (Of those entering treatment, n=165) • Of those parents entering treatment who were not already in treatment at the index petition, the median days until treatment entry were: • Comparison: 115 • KCFTC: 51 Proportion not admitted Note: Statistically significant difference, p < .05
FTC parents received broader service array Of those admitted to any treatment * Statistically significant difference, p < .05
FTC parents received broader service array Of those who received any treatment * Statistically significant difference, p < .05
FTC parents receive more treatment and are more likely to attend treatment(Of all treatment events) • Avg. # of treatment events per person who received treatment: • KCFTC = 145 • Comparison = 65 Note: Statistically significant difference, p < .05
Success in treatment • FTC parents remained in treatment twice as long (median of 109 days compared to 53) • FTC parents 37% more likely to be successfully discharged from treatment (74% compared to 54%)
Question 2: Do FTC families, compared to similar families who did not receive FTC services, have more positive child welfare outcomes? Specifically: • Do the children of FTC participants spend less time in out of home placement? • Are the children of FTC participants placed in permanent living situations more quickly overall? • Are FTC children more likely to have a permanent placement? • Are FTC participants less likely to have subsequent CPS referrals?
Child welfare outcomes • FTC children spent 30% less time in out-of-home placements (median of 481 days, compared to 689 for comparison group) • FTC children spent 20% less time in the child welfare system (median of 729 days, compared 819 for comparison group) • FTC children 43% more likely to have a permanent placement (60% compared to 42%) • FTC children 70% more likely to return to the care of their parent (58% compared to 34%)
Return home 34% 58% Permanent placement 42% 60% Permanent placements & returns home more likely for FTC children
Question 3: Do families of color have outcomes similar to families not of color?
Parent of color Parent white Parent of color Parent white Admitted to treatment through DBHR after petitionAll parents • Parents of color did not differ from white parents in their likelihood to: • Be in treatment when petition was filed • Be admitted to treatment after petition • Schedule treatment episode after petition is filed Note: No statistically significant differences
Median days until treatment entryOf those not in treatment at petition Parent white Parent of color Parent white Parent of color Note: White-white, p < .05 POC-POC, p < .10
Median days in first treatment Parent white Parent white Parent of color Note: White-white, p < .05 POC-POC, p < .10 FTC: POC-White mixed Parent of color
Length of time in first treatment episode • Of those parents entering treatment, the median days in first treatment episode: • Comparison, parent of color: 43 • Comparison, white: 53 • KCFTC, parent of color: 77 • KCFTC, white: 151 Note: No statistically significant differences
Percentage successfully completing a treatment episodeOf those receiving treatment Parent of color Parent white Parent of color Parent white Note: POC-POC p < .05 No other significant differences
Percentage of children with permanent placements Child white Child of color Child white Child of color Note: All: Comp-FTC p < .05 No other significant differences
Percentage of children remaining in out of home placement Child white Child of color Note: All: Comp-FTC p < .05 FTC: COC – Child white, p < .10 No other significant differences Child white Child of color
Comparing FTC to regular court for families of color • Generally indicate that families of color in FTC had more positive outcomes than families of color in the comparison group • 61% more likely to enter treatment • Enter treatment 63% faster • Remain in treatment nearly twice as long • 49% more likely to complete treatment • Children 39% more likely to be permanently placed • Children 54% more likely to be returned home
Comparisons by race in FTC • Parents of color in the FTC were not significantly different than white parents on: • Percentage admitted to treatment • Speed of admission to treatment • Percentage successfully completing treatment • Parents of color spent less time than white parents in treatment • Children of color might be more likely to remain in out-of-home placements (borderline significance)
Summary and conclusions • The King County Family Treatment Court is one of a variety of problem-solving courts • Staff from several disciplines and agencies collaborate on supervision and support • Stakeholders generally have positive opinions about the development and functioning of the court • Parents have more successful substance use treatment outcomes • Children are more likely to exit the child welfare system and be returned to the care of their parents
Please contact us with any questions Eric Bruns ebruns.@uw.edu Mike Pullmann pullmann@uw.edu Jill Murphy Jill.Murphy@kingcounty.gov Mark Wirschem Mark.Wirschem@kingcounty.gov
Parent white Parent white Parent of color Parent of color Median days until treatment entryAll parents Note: White-white, p < .05 POC-POC, p < .05 Comp White – Comp POC, p < .05 No differences for FTC groups
Median days until end of child’s out of home placement Child of color Child of color Child white Child white Note: White-white, p < .05 POC-POC, p < .10