Video Analysis Project
Analyze movie scenes as a psychologist, relate movie themes to personal experiences, and delve into psychological research methods. Explore illusions, hindsight bias, overconfidence, scientific method, hypothesis, types of research, and correlation controversies.

Video Analysis Project
E N D
Presentation Transcript
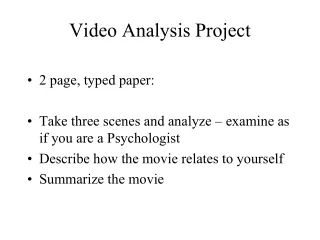
Video Analysis Project • 2 page, typed paper: • Take three scenes and analyze – examine as if you are a Psychologist • Describe how the movie relates to yourself • Summarize the movie
Psychological Research Methods Excavating Human Behaviors
Hindsight Bias • The tendency to believe, after learning the outcome, that you knew it all along. Only after Kerry won the Iowa Primary, did people begin to say that Dean was too liberal. What would people say about Kerry if Dean won?
Overconfidence • We tend to think we know more than we do. 82% of U.S. drivers consider themselves to be in the top 30% of their group in terms of safety 81% of new business owners felt they had an excellent chance of their businesses succeeding. When asked about the success of their peers, the answer was only 39%. (Now that's overconfidence!!!)
Scientific Method • Observe some aspect of the universe. • Invent a theory that is consistent with what you have observed. • Use the theory to make predictions. • Test those predictions by experiments or further observations. • Modify the theory in the light of your results. • Go to step 3.
Hypothesis • A tentative theory that has not yet been tested. • Have operational definitions. • Be replicable.
Types of Research • Case Study • Survey • Naturalistic Observation • Descriptive • Correlational • Experimental
Descriptive Research • Any research that observes and records. • Does not talk about relationships, it just describes.
The Case Study • Where one person (or situation) is observed in depth. What are the strengths and weaknesses of using a tragedy like the Columbine School Shootings as a case study?
The Survey Method • Used in both descriptional and correlational research. • Use Interview, mail, phone, internet etc… • The Good- cheap, anonymous, diverse population, and easy to get random sampling (a sampling that represents your population you want to study).
Naturalistic Observation • Observing and recording behavior in natural environment. • No control- just an observer. What are the benefits and detriments of Naturalistic Observation?
Types of Research • Case Study • Survey • Naturalistic Observation • Descriptive • Correlational • Experimental
Why do we sample? • One reason is the False Consensus Effect: the tendency to overestimate the extent to which others share our beliefs and behaviors.
Measured using a correlation coefficient. • A statistical measure of the extent to which two factors relate to one another
Correlation • Correlation Coefficient • a statistical measure of the extent to which two factors vary together, and thus how well either factor predicts the other Indicates direction of relationship (positive or negative) Correlation coefficient r = +.37 Indicates strength of relationship (0.00 to 1.00)
Correlation There is a positive correlation between ice cream and murder rates. Does that mean that ice cream causes murder?
Correlation • Scatterplot • a graphed cluster of dots, each of which represents the values of two variables • the slope of the points suggests the direction of the relationship • the amount of scatter suggests the strength of the correlation • little scatter indicates high correlation • also called a scattergram or scatter diagram
Perfect positive correlation (+1.00) No relationship (0.00) Perfect negative correlation (-1.00) Correlation Scatterplots, showing patterns of correlations
Height and Temperament of 20 Men Height in Inches Height in Inches Temperament Temperament Subject Subject 1 2 3 4 5 6 7 8 9 10 80 63 61 79 74 69 62 75 77 60 75 66 60 90 60 42 42 60 81 39 11 12 13 14 15 16 17 18 19 20 64 76 71 66 73 70 63 71 68 70 48 69 72 57 63 75 30 57 84 39 Correlation
95 90 85 80 75 70 65 60 55 50 45 40 35 30 25 Temperament scores Height in inches Correlation Scatterplot of Height and Temperament 55 60 65 70 75 80 85
Correlation Three Possible Cause-Effect Relationships could cause (1) Low self-esteem Depression or (2) Depression could cause Low self-esteem or Low self-esteem (3) Distressing events or biological predisposition could cause and Depression
Correlation DOES NOT equal causation Hippocrates’ Good News Survey found that people who often ate Frosted Flakes as children had half the cancer rate of those who never ate the cereal. Conversely, those who often ate oatmeal as children were four times more likely to develop cancer than those who did not. Does this mean that Frosted Flakes prevents cancer while oatmeal causes it? The GNS revealed that people who had had routine physicals in the previous 3 years were twice as likely to report high blood pressure and cholesterol levels. Do physical exams cause health problems?
Correlation DOES NOT equal causation Children with high self-esteem also tend to have high academic achievement. Why is this? They are both linked to intelligence and family social status.
Correlation DOES NOT equal causation John Paulos: Innumeracy: Mathematical Illiteracy and Its Consequences gives this: Two variables may be correlated because of their relationship to a third factor. In the New Hebrides Islands, body lice were at one time thought to produce good health Positive correlation between the quality of a state’s day care programs and the reported rated of child abuse.
Experimental Research • Explores cause and effect relationships. Constipation Eating too many bananas causes
Steps in Designing an Experiment • Hypothesis • Pick Population: Random Selection then Random Assignment. • Operationalize the Variables • Identify Independent and Dependent Variables. • Look for Extraneous Variables • Type of Experiment: Blind, Double Blind etc.. • Gather Data • Analyze Results
Experimental Vocabulary • Independent Variable: factor that is manipulated • Dependent Variable: factor that is measured • Extraneous Variables: factors that effect DV, that are not IV. • Experimental Group: Group exposed to IV • Control Group: Group not exposed to IV • Placebo: inert substance that is in place of IV in Control Group
Analyze Results • Use measures of central tendency (mean, median and mode). • Use measures of variation (range and standard deviation).
A Skewed Distribution Are the results positively or negatively skewed?
Some psychological research topics: • origins of stereotypes • development of language • causes of Alzheimer’s disease • accuracy of eyewitness testimony • personality & musical preference • treatment of eating disorders • causes of romantic love
Sampling Psychology: Examples of Psychological Research Findings: • visual perception & optical illusions • information processing & judgment • human memory • self-evaluation
Do you see the flashing dots? The flashing is all in your head.
TO THINK ABOUT OR DISCUSS: • Does the human visual system behave just like a video camera? • Could optical illusions ever cause accidents? • Could optical illusions ever prevent accidents?
A memory test: 1. Please listen carefully to the following list of words. 2. Please DO NOT write the words down. Just listen carefully.3. In a little while, I’ll ask you to remember the words.
Now count backwards with me slowly, by threes, from 45 to 3: 45, 42 … 3
Write down each word below:ghost cake blanket sweet rabbit candy2. Circle only the words you heard on the list. 3. If you VIVIDLY remember hearing a word, circle it twice.
Now examine the list carefully: • sour • candy • sugar • bitter • good • taste • tooth • nice • honey • soda • chocolate • heart • cake • tart • pie TO THINK ABOUT OR DISCUSS : Should this make us worry about eyewitness testimony?
Now we are going to do a simple activity involving letters of the alphabet. • Based on your gut feelings, quickly write down: • Your six FAVORITE letters • Your six LEAST FAVORITE letters
Look over each list and circle all of the letters that occur in your own first name. Count the number of circled letters in each list. Which list included more of the letters from your own first name??
The preference for the letters in one’s own name is the name letter effect. TO THINK ABOUT: Would people be more likely to purchase a product if the product resembled his or her name? Should the musician depicted here like M&Ms more than the average person does?
Psychological Science: • addresses important questions • can improve people’s lives • is a lot of fun!
Research Methods In Psychology Formal Experiments • Tests relationship of two or more variables • Allows conclusions about cause-and-effect • Quantitative measures of behavior compared in different conditions created by researchers • Evidence supports or rejects hypothesis
Research Methods In Psychology Formal Experiments • Elements • Independent variable – gets manipulated • Dependent variable – amount of change • Experimental group – exposed to independent variable or conditions expected to create change • Control group – presents normal behavior used for comparison • Random assignment • Experimental control