Data gathering
Data gathering. Today’s objectives. Data gathering and analysis Class activity Discuss eye tracking assignment. Eye tracking assignment. Identify a question statement/hypothesis about what will attract user’s visual attention. What answers did you find? What were your overall observations?.


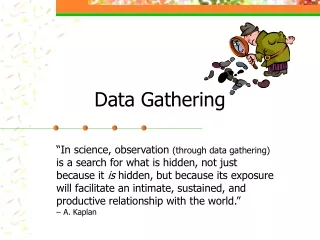
Data gathering
E N D
Presentation Transcript
Today’s objectives • Data gathering and analysis • Class activity • Discuss eye tracking assignment
Eye tracking assignment • Identify a question statement/hypothesis about what will attract user’s visual attention. • What answers did you find? • What were your overall observations?
Data gathering and analysis • Often you must determine the effectiveness of one design or feature or function over another. • What interface is more efficient? • What device design accommodates users’ hand movements best. • What is the best menu structure? • Etc.
Overview • Four key issues of data gathering • Data recording • Interviews • Questionnaires • Observation • Choosing and combining techniques
Four key issues • Setting goals • Asking questions | making predictions • Decide how to analyze data once collected • Identifying participants • Decide who to gather data from • Relationship with participants • Clear and professional • Informed consent when appropriate • Triangulation • Use more than one approach • Pilot studies • Small trial of main study
Asking questions | predictions T T • Q. Are Sans Serif fonts easier to read on screen? • Predictions: • Information written in sans serif type will be read faster than information written in serif type. • Information written in sans serif type will be read faster on Retina display devices than information written in serif type.
Asking questions | predictions • Q. Is checkout procedure A more efficient (takes less time) than checkout procedure B.
Collecting Data: Interviews | Focus Groups • Unstructured - are not directed by a script. Rich but not replicable. • Structured - are tightlyscripted, often like a questionnaire. Replicable but may lack richness. • Semi-structured - guided by a script but interesting issues can be explored in more depth. Can provide a good balance between richness and ability to replicate.
Interview questions • Two types: • ‘closed questions’ have a predetermined answer format, e.g., ‘yes’ or ‘no’ • ‘open questions’ do not have a predetermined format • Avoid: • Compound sentences - split them into two • Jargon and language that the interviewee may not understand • Leading questions that make assumptions e.g., why do you like …?
Interview questions • Compound sentences - split them into two • Do you like the information structure and the navigation labels? NO! • Do you like the information structure? YES • Do you like the navigation labels? NO
Interview questions • Compound sentences - split them into two. • Do you find the text helpful and navigation easily to follow? • Do you find the text helpful? • Do you find navigation easily to follow? • Jargon and language that the interviewee may not understand. • Did you find the UX section of the HCI and IDs category useful? • Did the UI implementation of JS work?
Leading questions that make assumptions: I know this screen is crowded but can you find…
Running the interview |Focus group • Introduction– • introduce yourself, • explain the goals of the interview, • reassure about the ethical issues, • ask to record, • present any informed consent form. • Warm-up– make first questions easy and non-threatening. • Main body – present questions in alogicalorder • A cool-off period – includea few easy questions to defuse tension at the end • Closure – thank interviewee, signal the end, e.g., switch recorder off.
Enriching the interview process • Props - devices for prompting interviewee, e.g., a prototype, scenario Focus groups Props
Questionnaire design • Decide on whether phrases will all be positive, all negative or mixed. • I like this website (SD) 1 2 3 4 5 (SA) • Navigation was NOT easy (SD)1 2 3 4 5 (SA) • Information was easy to find (SD)1 2 3 4 5 (SA)
Question and response format • Rating scales • Likert scales • (SA) 1 2 3 4 5 (SD) or (SD) 1 2 3 4 5 (SA) • semantic scales • (Clear) |_|_|_|_|_|_|_|_| (Confusing) • (Usable) |_|_|_|_|_|_|_|_| (Unusable)
Encouraging a good response • Make sure purpose of study is clear • Promise anonymity • Offer a short version for those who do not have time to complete a long questionnaire • Follow-up with emails, phone calls, letters • Provide an incentive • 40% response rate is high, 20% is often acceptable
Advantages of online questionnaires • Responses are usually received quickly • No copying and postage costs • Data can be collected in database for analysis • Time required for data analysis is reduced • Errors can be corrected easily
Problems with online questionnaires • Preventing individuals from responding more than once
Observation • Direct observation in the field • Degree of participation (insider or outsider) • Ethnography • Direct observation in controlled environments • Indirect observation: tracking users’ activities • Diaries • Interaction logging • Analytics
Direct observation in a controlled setting • Think-aloud technique • Usability studies • AB Testing • Indirect observation • Diaries • Interaction logs
Choosing and combining techniques • Depends on • The focus of the study • The participants involved • The nature of the technique • The resources available
Video Sketching: http://www.youtube.com/watch?v=3Sk7cOqB9Dk&feature=youtu.be
Source: http://www.uxbooth.com/articles/tools-for-sketching-user-experiences/
Source: http://boxesandarrows.com/storyboarding-ipad-transitions/
Sketch the checkout process (assume the user is buying a loaf of bread or some other product of your choice). Sketch two alternative designs. Ask yourself questions about the designs. Write your questions down. Make predictions/hypotheses. Collect data.
Question: Will Pop-up selection result in reduce check-out time and greater customer satisfaction? Hypothesis: Users will complete checkouts with Pop-up selection (Design A) quicker than link selection (Design B).
Overview • Quantitative analysis • Qualitative analysis • Tools to support data analysis • Theoretical frameworks • Presenting the findings
Quantitative and qualitative • Quantitative data – expressed as numbers • Qualitative data – difficult to measure sensibly as numbers, e.g. count number of words to measure dissatisfaction • Quantitative analysis – numerical methods to ascertainsize, magnitude, amount • Qualitative analysis – expresses the nature of elements and is represented as themes, patterns, stories
Simple quantitative analysis • Averages • Mean: add up values and divide by number of data points • Median: middle value of data when ranked • Mode: figure that appears most often in the data • Percentages • Graphical representations give overview of data
Simple qualitative analysis • Unstructured - are not directed by a script. Rich but not replicable. • Structured - are tightly scripted, often like a questionnaire. Replicable but may lack richness. • Semi-structured - guided by a script but interesting issues can be explored in more depth.
Visualizing log data Interaction profiles of players in online game Log of web page activity
Date Online discussion Time
Web Behavior Graph New York Times
Simple qualitative analysis • Recurring patterns or themes • Emergent from data, dependent on observation framework if used • Categorizingdata • Categorization scheme may be emergent or pre-specified • Looking for critical incidents • Helps to focus in on key events
Tools to support data analysis • Spreadsheet – simple to use, basic graphs • Statistical packages, e.g. SPSS • Other data analysis tools • Categorization and theme-based analysis • Quantitative analysis of text-based data • NuD*IST • Observer XT • Morae • AtLast ti
Theoretical frameworks for qualitative analysis • Basing data analysis around theoretical frameworks provides further insight • Three such frameworks are: • Grounded Theory • Distributed Cognition • Activity Theory
Grounded Theory • Aims to derive theory from systematic analysis of data • Based on categorization approach (called ‘coding’) • Researchers are encouraged to draw on own theoretical backgrounds to inform analysis
Web Behavior Graph New York Times LevenShtien Distance
Distributed Cognition • The people, environment & artifacts are regarded as one cognitive system • Used for analyzing collaborative work • Focuses on information propagation & transformation
Activity Theory • Explains human behavior in terms of practical activity with the world. • When people interact with environment, production of tools results. • Tools are "exteriorized" forms of mental processes. • Provides framework that focuses analysis around the concept of an ‘activity’. • Stresses importance of involving representatives of the target community in the process of designing any type of computer mediated artifact. • (http://www.slis.indiana.edu/faculty/yrogers/act_theory2/)
Presenting the findings • Only make claims that your data can support • The best way to present your findings depends on the audience, the purpose, and the data gathering and analysis undertaken • Graphical representations