Download
1 / 21
250 likes | 1.07k Vues
Specific Issues in Data Screening. Accuracy of data filefor continuous variables:means, standard deviations reasonable?all values

E N D
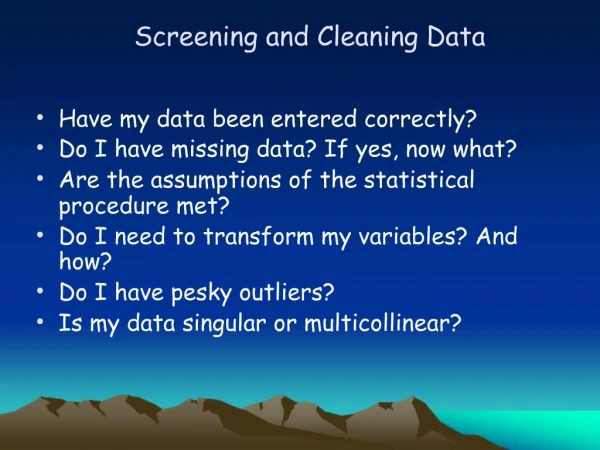
1. Screening and Cleaning Data Have my data been entered correctly?
Do I have missing data? If yes, now what?
Are the assumptions of the statistical procedure met?
Do I need to transform my variables? And how?
Do I have pesky outliers?
Is my data singular or multicollinear?
2. Specific Issues in Data Screening Accuracy of data file
for continuous variables:
means, standard deviations reasonable?
all values �in range�?
for discrete variables:
splits reasonable?
all values �in range�?
Have you correctly programmed missing values?
3. Missing Data How missing data occurs
overlooked questions
missing scores not related to other measured variables
missing values a function of other measured variables
e.g., missing income scores for low education participants
Pattern and amount of missing data are important
4. Missing Data Types of missing data
Missing completely at random (MCAR)
missingness on a variable does NOT depend on the variable itself or any other variable in the data set
no patterns of missingness
e.g., no differences between those with missing data and individuals with complete data on measured variables
can be tested in SPSS the MVA procedure
consult the MCAR test
want it to be non-significant
5. Missing Data Missing at random (MAR)
missingness on a variable is predictable from other variables
missingness related to other variables, not DV
Missing not at random (MNAR)
missingness is related to the DV
e.g., chronic smoker enrolled in a smoking cessation study misses an assessment
problem with this approach, this can typically only be inferred
6. Missing Data continued Rule of thumb: < 5% of cases missing, any substitution method is generally OK
Testing the missing data (how are they different?)
i.e., look for differences as a function of missingness
How do you do this?
create a (or a number) of dummy-coded variables (missing/not missing)
or create multiple variables if missing data patterns emerge
run t-tests, regressions, and chi-square tests with other variables to determine if differences exist
demographics, other target study variables
differences exist...what do we do?
7. Missing Data continued What do we do with missing cases?
deleting variables
> 50% missing...yikes...delete variable
create a dummy-coded missing data variable for analyses
deleting cases
listwise deletion
delete cases with missing values altogether
pairwise deletion
keep cases with missing values
not OK ever, never, ever
8. Missing Data continued Methods for estimating (imputing) missing values:
�best guess� = prior knowledge
mean substitution
regression substitution (insert predicted value)
problem: predicted score is �better� than actual score
9. Missing Data continued Hot-deck imputation
missing value replaced by randomly chosen case that is similar
Maximum Likelihood (ML) - Expectation maximization (EM algorithm)
assumes a (normal) distribution
estimates a correlation (covariance) matrix for missing values using existing & missing data
uses maximum likelihood (ML) estimation
�best� method and easily accessible in SPSS
does NOT use random error
10. Missing Data continued Multiple imputation
similar to EM method, however...
create a missing data score for multiple data sets using EM or data augmentation (DA; Markov Chain Monte Carlo procedures)
injects random error into the process
then average parameter estimates across data sets or...
analyze individual data sets
Schaefer, J.L., & Graham, J.W. (2002). Missing data: Our view of the state of the art. -Psychological Methods, 2, 147-177.
11. Outliers Univariate vs. Multivariate outliers
Primary reasons for outliers
incorrect data entry
individual is not from the population of choice
Detecting univariate outliers
for dichotomous variables: uneven (90-10) splits
for continuous variables:
z-scores greater than 3.29 (p < .001) or larger
deleted z-scores greater than 3.29
12. Outliers continued graphical methods:
histogram, box plot, normal probability plots, etc.
Detecting multivariate outliers
using Mahalanobis (MAHAL) distance
distance of a case from the centroid (??) of remaining cases
centroid = where the means for all target variables intersect
statistically test cases using ?2
? = .001, df = # target variables
13. Outliers continued can also use indices of leverage, discrepancy, & influence
forms of MAHAL
What to do with outliers
determine if they are part of the sample
create dummy-coded variable (outlier/nonoutlier)
run analyses on other variables (demographics)
determine if you will delete case or modify score
data transformations (to come later)
14. Normality Univariate vs. Multivariate Normality
Check distributions at the univariate level
skewness and kurtosis (statistical tests)
check (detrended) expected normal probability plots
compares expected to observed values
Can use Mardia�s coefficient to test for multivariate normality
Assume robustness???!!!!
15. Linearity The dreaded straight-line (Pearson�s r)
Diagnosed primarily from bivariate scatterplots
lowess fit line
What to do if nonlinearity exists?
transform variables
dichotomize
use nonlinear statistical methods
16. Homoscedasticity and Homogeneity of Variance-Covariance Matrices Homoscedasticity
for ungrouped data:
variability in scores for one continuous variable is the same at all values of a second
i.e., you have similar distributions
I will attempt to draw
Homogeneity of Variance-Covariance for multivariate data (Box�s M test)
for grouped data
17. Data Transformations Used to reduce outlier impact and improve distribution of data
These are not universally recommended!
interpretative problems
Types of transformations
square root: good for moderate departures from normality
makes larger numbers smaller
I attempt to draw yet again
a beautiful, positively-skewed distribution
18. Data Transformations continued log: good for substantial departures from normality
base 10 function ? x = 10y ? 100 = 10y
makes smaller numbers larger, and vice versa
dichotomization: when nothing else works
19. Data Transformations continued Direction of deviation (skew) is important
reflect for negative skew
add �1� to largest score to form a constant
subtract each original score from the constant
transform as previous
the interpretative direction has also changed
Can also add a value of one to each score if you have scores of less than one
important when taking square root or log, respectively
decimals give you larger numbers and negative numbers, respectively.
20. Multicollinearity and Singularity Multicollinearity = variables are too highly correlated
Singularity = variables are redundant
Correlations > .70 are generally problematic
These both inhibit matrix inversion! Like you care!
run your analyses and see if the computer throws-up
Procedure:
calculate collinearity diagnostics
squared multiple correlations (VIF), tolerance
21. Steps for screening (un)grouped data Analyses include regression, canonical correlation, factor analysis, SEM
"Steps":
check distributions for normality, univariate outliers, missing data
check plots for linearity and homoscedasticity
transform variable(s) if needed
calculate Mahalanobis distance (multivariate outliers)
if identified, delete or modify outliers
deal with missing data
rerun everything if you use a form of substitution
22. Steps for screening grouped data Analyses include MANOVA, Discriminant Function Analysis, and Multigroup CFA and SEM
Steps are the same as with ungrouped data
just do parallel screening within each substantive subgroup that you care about
e.g., within gender groups, ethnic groups, experimental groups, etc.