Download
1 / 92
940 likes | 1.12k Vues
Vulnerability Assessment and Adaptation Policies for C C Impacts on the Nile Delta Coastal Zones. By Prof. Dr. Ibrahim Abdelmagid Elshinnawy Director of Coastal Research Institute (CoRI) National Water Research Center (NWRC). Global Perspective.

E N D
Vulnerability Assessment and Adaptation Policies for C C Impacts on theNile Delta Coastal Zones By Prof. Dr. Ibrahim Abdelmagid Elshinnawy Director of Coastal Research Institute (CoRI) National Water Research Center (NWRC)
Climate-induced increases in sea level are caused by thermal expansion of the oceans and melting of land ice and ice sheets
Global Mean Sea Level from Tidal Gauge observations around the world 2.0 mm/year 0.8 mm/year Average Rate ~ 1.8 mm/year
Global mean temperatures are rising faster with time Warmest 12 years: 1998,2005,2003,2002,2004,2006, 2001,1997,1995,1999,1990,2000 50 0.1280.026 100 0.0740.018 Period Rate Years /decade
20 15 10 5 MSL (mm) 0 D -5 -10 -15 1960 1970 1980 1990 2000 Year Contribution to Sea Level by Thermal Expansion Rate = 0.4 mm/year (1955-2004)
25 20 15 10 5 0 1960 1970 1980 1990 2000 2010 Contribution to Sea Level by Mountain Glaciers 1961-2003: 0.5 mm/year MSL (mm) D Year
Sea Level Budget (IPCC-2007, mm/year) 1993-2003 1961-2003 Thermal Expansion 1.6 ± 0.5 0.4 ± 0.1 + Mountain Glaciers 0.8 ± 0.2 0.5 ± 0.2 + Greenland Ice Melt 0.1 ± 0.1 0.2 ± 0.1 + Antarctic Ice Melt 0.2 ± 0.3 0.1 ± 0.4 Land Water Storage ? ? Total of Observed Contributions 2.8 ± 0.7 1.1 ± 0.5 = Observed Sea Level Change 3.1 ± 0.7 1.8 ± 0.5
According to observations and measurements, average global increase in sea level is 1-2 mm/year. • Mean Sea Level is projected to rise by 0.18 m to 0.59 m by 2100, But with Significant Regional Variations, IPCC 2007)
Global sea-level change over the past 160,000 years • Sea level highly variable due to natural processes • Sea level -120 m lower and +4-6 m higher than present (Chappell & Shackleton, 1986)
Global mean surface temperature is projected to increase during the 21st century according to special report on emission reduction scenarios (SRES)
Projected global averaged surface warming and sea level rise till 2100, IPCC-2007
Attributed trends depend on observations not model simulated trends Original model trend Temperature Observations + internal variability Time
Attributed trends depend on observations not model simulated trends Scaling Original model trend Upper Temperature Lower Observations + internal variability Attributed trend + uncertainty estimate Time
Impact of climate changes on coastal zones was investigated by MWRI, Coastal Research Institute (CoRI) and Delft Hydraulics, Netherlands (1989-1992) The study at that time has estimated the sea level rise impact on all the entire coastal zones of Egypt (3500 km) in terms of quality and quantity. The study focused on the Nile Delta coast as it has been considered the most vulnerable area in the coastal zones of Egypt The study estimated the impacts of sea level rise if water has raisin by 1m, 2m, and 3m as shown in the figure.
Egyptian Coastline15 Coastal Segments for Vulnerability Assessment Study
1m zone 2m zone 3m zone Results of the study show the vulnerable areas to sea level rise in the Nile Delta with different water levels
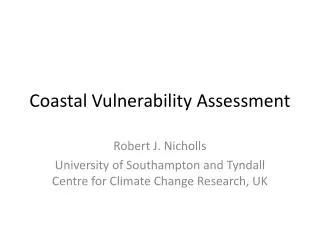
Vulnerability Analysis Physical Mechanisms Shoreline erosion/accretion Flood frequency Directly exposed hydraulic structures : e.g. ports, commercial facilities, fish farms Salinity intrusion Major Impact and possible losses Water level, waves characteristics, sediment flow, salinity levels Ecological sustainability Socio-economic responses, recreational capacity, tourism Agricultural activities and drainage conditions Fresh groundwater availability
Conclusion & Recommendations (1992) Conclusions If no response strategies are planned, major adverse impacts and serious losses are expected in terms of: Deficiency in infrastructure functionality Community displacement Ecological deterioration Penetration of salt wedge Deficiency in drainage capacity Recommendations A comprehensive national response strategy Coordinative actions to minimize risks and maintain ecosystem Preparation of integrated coastal zone management scheme Regular monitoring of vulnerable regions Further studies & follow up of technological developments
Results by CoRI & Delft (1992) and IPCC (2006)are comparable Because both studies ignored the morphological features of the coastal zone of the Nile Delta as (coastal sand dunes and ridges). Vulnerable areas defined by IPCC in 2007 Vulnerable areas defined by CoRI and Delft in 1992.
MWRI (Coastal Research Institute) increased its activities to define precisely the vulnerable areas taking into account the morphological features of the Nile Delta coastal zones (Sand dunes and Ridges) About 200 hydrographic beach profiles along the Nile Delta coast
DAMIETTA PROMONTORY ROSETTA PROMONTORY 32o 00' Mediterranean Sea BURULLUS Baltim 31o 30' Gamasa Burullus Lagoon Abu Quir Bay Port Said NILE DELTA Manzala Lagoon Damietta Branch Rosetta Branch Idku Lagoon 31o 00' Old Dunes Cultivated Land Suez Canal Beach and backshore 20 km 0 Coastal Dunes Desert Northern Coast Ridge توزيع الكثبان الرملية على طول دلتا نهر النيل 30o 00' 30o 30' 31o 00' 32o 00' 31o 30' 32o 30'
Trend and Accelerated Sea Level Rise (ASLR) Measured Along the Nile Delta Coast. (CoRI-2007), First Scenario
Two Modules have been developed and in each module three scenarios were established • The first scenario was established by assuming that the same rate of temperature change (0.6 ºC over the last century) will occur till 2100. • The second scenario was established by temperature projection till 2100. Temperature change is assumed to be 1.8 ºC above 1990 limit till the end of the current century. • The third scenario was established by temperature projection to be 4.0 ºC above 1990 limit till the end of the current century.
Mediterranean Hydrological Factors • Area = 2.5 million km2 • Max Depth = 4400 m • Ave Depth = 1500 m • Water Vol. = 3.7 million km3 • Water body comprises 3 layers with different temperature and salinity profiles • Surface layer (75-300 m depth) • Intermediate layer (300-600 m depth) • Lower layer (more than 600 m depth)
Mediterranean Annual Water Balance Evaporation 4144 km3 Income rainfall 1000 km3 River flow 230 km3 Black Sea flow 152 km3 Total Inflow 1382 km3 Deficit 2762 km3 This deficit is compensated by 40,000 m3/s from Atlantic Ocean through Gabal Tarek straight in an anti-clockwise flow as water level in eastern side of the sea is 80 cm lower than that in the ocean due to increased evaporation rates difference.
Preliminary Results Module (1) Business as usual
Expected Impact of SLR due to Tide Gauges Till 2100, (CoRI 2007) 2050 2025 2075 2100
Total affected area and its percentage to the Nile Delta area According to CoRI measurements till 2100 (Without Mohammed Ali wall and zero level for lakes borders)
Expected SLR Till 2100 by Projected Increase in Air Temperature (B1 Scenario(
ExpectedImpact of SLR Due to Projected Values of The Mean Air Temperature Till 2100, B1 Scenario 2050 2025 2075 2100
Total affected area and its percentage to the Nile Delta area According to B1 scenario till 2100 (Without Mohammed Ali wall and zero level for lakes borders)
Expected SLR Till 2100 by Projected Increase in Air Temperature (A1F1 Scenario(
ExpectedImpact of SLR Due to Projected Values of The Mean Air Temperature Till 2100, A1F1 Scenario 2025 2050 2075 2100
Total affected area and its percentage to the Nile Delta area (A1F1 scenario) (With Mohammed Ali wall and zero level for lakes borders)
Final Results Module (2) Considering Natural and Man-made Protection Systems
Difference between Al-Manzala Lake water level and Al-Salam Canal Bank level
Al-Rodah (12 km) (2.84 m) Al-Lithy (27 km) (3.6 m) Al-Shipool (38 km) (3.13m) Al=Atwy (8km) (3.28m) Al-Manzala Lake Borders
Al-Burullus Lake Borders Baltim (+2.0 m) E West Al-Burullus Port (+1.5 m ) N Baltim (+2.0 m) - E West New Port (+1.5 m) - N Brimbal Area (+1.75 m) W New Road to Kafr Al-Sheikh (+2.15) S New Road (+ 2.15 m) S