Download
1 / 31
520 likes | 956 Vues
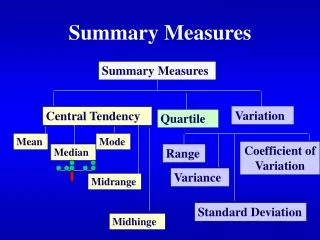
Summary of measures of population Health. Farid Najafi MD PhD School of Population Health Kermanshah University of Medical Sciences. Rational and objectives. How is it possible to compare the overall health status of a population with another population Objectives

E N D
Summary of measures of population Health FaridNajafi MD PhD School of Population Health Kermanshah University of Medical Sciences
Rational and objectives • How is it possible to compare the overall health status of a population with another population • Objectives • Calculation of life expectancy • Interpretation of health expectancies • Interpretation of health gaps • Social value choices made in constructing summary measures of population health
Importance of indicators • Importance of a comprehensive health indicator • Infant and maternal mortality? • Such indicators should be simple (preferably a single number) with an intuitive interpretation
Life expectancy • Life expectancy at birth is a widely used indicator • Summarises the detailed current age-specific mortality into a single number • Calculated life expectancy is an underestimate of the actual number of years a newborn may expect to live • WHO annually publishes life expectancy per country (www.who.int/whr/en/)
Interpretation • Improvement over time • Most gains were made at birth rather than at age 30 or age 65 • Reflection of prevention of childhood infections due to improvements in housing, nutrition and other socio-economic circumstances
Life table • Life expectancy is calculated using life table • It describes what would happen to a hypothetical group of 100000 newborn infants if they would experience the same mortality rate at each age as are recorded currently in the population of interest.
Definition of items in life table • Ix= Life table cohort. A cohort to follow for dying of all of them • Lx= years of lived=Ix+1+dx/2 • Tx=Cumulative years lived • T97=T98+T99+T100 • ex=life expectancy
More interpretation on life table • life expectancy as an age-weighted mortality indicator • Value of preventing death at different age • Preventing death at age 0 save 76 years • Preventing death at age 98 save 2.55 years
Years of life lost • Potential years of life lost (PYLL): developed in 1940s to describe mortality due to tuberculosis • Advantages: • Easy to calculate • Younger age death counts for more • Can be calculated for specific cause • Disadvantage: • Arbitrary cut of point • Exclusion of some deaths
PYLL • First a cut-off must be chosen: the age below which deaths are considered ‘premature’ • Often a cut-off of 65 or 70 is chosen • Summing all the differences over all deaths
Expected years of life lost (EYLL) • The number of life years lost by a death is equal to the life expectancy at that age • Death at younger ages count for more • EYLL can be calculated for specific diseases • Problem of equity: • Comparing two ethnic group with their life table?
Gaps and expectancies • Health expectancies • Life expectancy • Not possible to subdivide life expectancy into separate disease-specific expectancies • Cause-elimination life table • Health Gaps • Years of life lost • PYLL and EYLL • Population size matters for the gaps but not for the expectancies: years of life lost for large population is larger than for a small population
Adding morbidity • The simplest way to combine mortality and morbidity into a single health expectancy is to calculate disability free life expectancy (DFLE) • It needs normal life table plus age-specific data on disability prevalence from a survey • It involves adjusting the number of years lived by survivors in each age group by the probability that those years are lived with a disability • Disadvantages • Disability score • It ignores years lived with disability- equality of years lost by death and years lived with disability
Quality adjusted life year (QALY) • The concept developed as an outcome measure in clinical trial • Here the benefit is defined as a better survival, a better health-related quality of life, or any combination of the two • Benefit of hip replacement • Basic idea: a life year lived in perfect health gets a health related quality of 1, and a year not lived (dead) gets a quality of 0. All health states between perfect health and death get a value between 1 and 0.
Example • 5 years lived, of which 3 in perfect health (quality=1), 1.5 with mild pain (quality=0.8) and 0.5 with sever pain (quality=0.4) amounts to 4.4 QALYs
Disability adjusted life years (DALYs) • Developed by Christopher Murray and Alan Lopez for global burden of disease • Is a health gap indicator
Issues • How long should people in good health expect to live? • Are all people equal? Do all people lose the same amount of health through death at a given age, even if there are variations in current life expectancies between population groups? • Use of a standard life table with life expectancy at birth of 82.5 in women with a lower standard for men (80 years)
Issues • How should we compare years of life lost through death with years lived with poor health or disability of various levels of severity? • Years lived with disability (YLD) for each disease is calculated using disease incidence, duration of disease, and a severity adjustment using a disability weight (DW) • Severity scales between 0 (being perfect health) and 1 ( being the worst possible health state (equated to being dead)
Issues • Is a year of healthy life gained now worth more to society than a year of healthy life gained sometime in future, for instance in 20 years’ time? • A 3% time discount rate is applied to future health loss to estimate the net present value of years of life lost. • A year of healthy life gained in 10 years’ time is worth 26% less than one gained now
Issues • Are lost years of healthy live valued more at some ages than others? • GBD weighted a year of healthy live lived at young ages and older ages lower than for other ages