Collecting user requirements Introduction to process modeling
570 likes | 755 Vues
Collecting user requirements Introduction to process modeling. BCIS 4610. Agenda. Schedule/Announcements Project proposals HW 1 due HW 2 due Oct 1 Ch. 7, Pr 11 from your book To be completed in Oracle Designer Process modeling Data flow modeling Introduction to Oracle Designer .

Collecting user requirements Introduction to process modeling
E N D
Presentation Transcript
Collecting user requirementsIntroduction to process modeling BCIS 4610 BCIS 4610, Fall 2008
Agenda • Schedule/Announcements • Project proposals • HW 1 due • HW 2 • due Oct 1 • Ch. 7, Pr 11 from your book • To be completed in Oracle Designer • Process modeling • Data flow modeling • Introduction to Oracle Designer BCIS 4610, Fall 2008
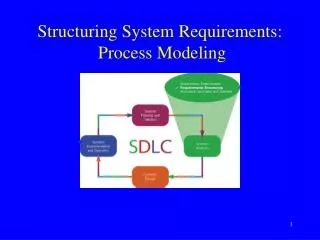
System Requirements Determination BCIS 4610, Fall 2008
Requirements Modeling Techniques: Process/Flow Modeling • Activity diagram – Object-Oriented • Data flow diagram • Flowchart – similar to workflow models, usually more technical, used for 3rd generations languages • Sequence diagram – Object-Oriented • State machine diagram • Workflow models (Process maps) BCIS 4610, Fall 2008
Workflow diagrams BCIS 4610, Fall 2008
Workflow Diagrams/Process Maps • A workflow model is a visual representation of the flow of work in a business area. Workflow models are used to document how work processes are carried out, and to find opportunities for process improvement. • Purpose - Workflow models are used to depict the sequential flow of a work process. • A workflow model represents: • business activities, • the sequential flow of these activities, • the persons who perform the work, • key business decisions that affect the flow of work, and • the start and end points of the process flow. BCIS 4610, Fall 2008
Key elements • Activities/Tasks: rounded rectangles show the individual steps or pieces of work that must be completed in order to execute the business process. • Sequential flows: arrows indicate the direction of the step by step sequence of the workflow. • Decision points: diamond shapes show forks where the flow of work proceeds in two or more mutually exclusive flows and, optionally, where separate flows merge together. • Parallel flows: solid bars indicate branch points where the flow of work proceeds in two or more parallel paths which subsequently join together again. • Swim-lanes: horizontal or vertical divisions indicate responsibility for performance of the activities. • Terminal: symbols indicating the start and end points of the flow. BCIS 4610, Fall 2008
Strengths and weaknesses • Strengths • Ability to visually represent complex flows with multiple decision points and parallel flows • Easy to develop and easily understood by most audiences • Support the identification of problems and alternative solutions • Can show a workflow across the enterprise, or within one functional area • Weaknesses • Multiple sets of diagramming conventions (ANSI/ISO, UML, IDEF3, BPMN etc.) BCIS 4610, Fall 2008
MS Visio notations BCIS 4610, Fall 2008
Business Process Modeling Notation (BPMN) • The (BPMN) is a standardized graphical notation for drawing business processes in a workflow. • BPMN was developed by Business Process Management Initiative (BPMI), and is now being maintained by the Object Management Group since the two organizations merged in 2005. Its current adopted version is 1.1 and the proposed one is 2.0. • The primary goal of BPMN is to provide a standard notation that is readily understandable by all business stakeholders. BCIS 4610, Fall 2008
Business Process Modeling Notation (BPMN) BCIS 4610, Fall 2008
Data flow diagrams BCIS 4610, Fall 2008
DFDs • Purpose - To show how information is input, processed, stored, and output from a system. • Provides a data-centric view of the scope of the project, representing what the system does, not how it does it. It is intended as a communication method between business and system stakeholders. It may be used to represent an automated system or a business system. • The Data Flow Diagram (DFD) provides a visual representation of the: • External Entities that provide data to, or receive data from, a system • The Processes of the system that transform data • The Data Stores in which data is collected for some period of time • The Data Flows by which data moves between External Entities, Processes and • Data Stores BCIS 4610, Fall 2008
Data Flow Diagram (DFD) • A picture of the movement of data between external entities and the processes and data stores within a system • Difference from system flowcharts: • DFDs depict logical data flow independent of technology • Flowcharts depict details of physical systems • Difference from process maps (Wor • Process maps are concerned with timing and sequencing, and DFDs are not • Process maps are often concerns with roles and who is responsible for each step, and DFDs are not • In DFDs more attention should be paid to accuracy of each data flow • Process map boundaries are usually restricted by the process, and the DFD boundaries by the boundaries of the system BCIS 4610, Fall 2008
Strengths • May be used as a discovery technique for processes and data, or as a technique forverificationof a Functional Decomposition and Entity Relationship Diagram that havealreadybeen completed. • Most users find these diagrams quite easy to understand • Generally considered a useful analysis deliverable to developers in a structured programming environment. • Weaknesses • May not be the most useful analysis deliverable to developers in an object-oriented environment. BCIS 4610, Fall 2008
Example of a DFD BCIS 4610, Fall 2008
DFD Symbols (cont.) • Process: work or actions performed on data (inside the system) • Data store: data at rest (inside the system) • Source/sink: external entity that is origin or destination of data (outside the system) • Data flow: arrows depicting movement of data BCIS 4610, Fall 2008
DFD Symbols BCIS 4610, Fall 2008
DFD for Hoosier Burger’s Inventory Control System BCIS 4610, Fall 2008
Differences between Sources/Sinks and Processes BCIS 4610, Fall 2008
Differences between Sources/Sinks and Processes BCIS 4610, Fall 2008
DFD Diagramming RulesProcess No process can have only outputs or only inputs…processes must have both outputs and inputs. Process labels should be verb phrases. BCIS 4610, Fall 2008
DFD Diagramming RulesData Store • All flows to or from a data store must move through a process. • Data store labels should be noun phrases. BCIS 4610, Fall 2008
DFD Diagramming RulesSource/Sink • No data moves directly between external entities without going through a process. • Interactions between external entities without intervening processes are outside the system and therefore not represented in the DFD. • Source and sink labels should be noun phrases. BCIS 4610, Fall 2008
DFD Diagramming RulesData Flow • Bidirectional flow between process and data store is represented by two separate arrows. • Forked data flow must refer to exact same data item (not different data items) from a common location to multiple destinations. BCIS 4610, Fall 2008
DFD Diagramming RulesData Flow (cont.) • Joined data flow must refer to exact same data item (not different data items) from multiple sources to a common location. • Data flow cannot go directly from a process to itself, must go through intervening processes. BCIS 4610, Fall 2008
DFD Diagramming RulesData Flow (cont.) • Data flow from a process to a data store means update (insert, delete or change). • Data flow from a data store to a process means retrieve or use. • Data flow labels should be noun phrases. BCIS 4610, Fall 2008
Guidelines for Drawing DFDs • Completeness • DFD must include all components necessary for system. • Each component must be fully described in the project dictionary or CASE repository. • Consistency • The extent to which information contained on one level of a set of nested DFDs is also included on other levels. BCIS 4610, Fall 2008
Functional Decomposition • An iterative process of breaking a system description down into finer and finer detail • High-level processes described in terms of lower-level sub-processes • DFD charts created for each level of detail BCIS 4610, Fall 2008
Guidelines for Drawing DFDs (cont.) • Timing • Time is not represented well on DFDs. • Best to draw DFDs as if the system has never started and will never stop. • Iterative Development • Analyst should expect to redraw diagram several times before reaching the closest approximation to the system being modeled. BCIS 4610, Fall 2008
DFD Levels • Context DFD • Overview of the organizational system • Level-0 DFD • Representation of system’s major processes at high level of abstraction • Level-1 DFD • Results from decomposition of Level 0 diagram • Level-n DFD • Results from decomposition of Level n-1 diagram BCIS 4610, Fall 2008
Context Diagram Context diagram shows the system boundaries, external entities that interact with the system, and major information flows between entities and the system. NOTE: only one process symbol, and no data stores shown. BCIS 4610, Fall 2008
Level-0 DFD Level-0 DFD shows the system’s major processes, data flows, and data stores at a high level of abstraction. Processes are labeled 1.0, 2.0, etc. These will be decomposed into more primitive (lower-level) DFDs. BCIS 4610, Fall 2008
Level-1 DFD Level-1 DFD shows the sub-processes of one of the processes in the Level-0 DFD. This is a Level-1 DFD for Process 4.0. Processes are labeled 4.1, 4.2, etc. These can be further decomposed in more primitive (lower-level) DFDs if necessary. BCIS 4610, Fall 2008
Level-n DFD Level-n DFD shows the sub-processes of one of the processes in the Level n-1 DFD. This is a Level-2 DFD for Process 4.3. Processes are labeled 4.3.1, 4.3.2, etc. If this is the lowest level of the hierarchy, it is called a primitive DFD. BCIS 4610, Fall 2008
Rules for stopping decomposition • When each process has been reduced to a single decision, calculation or database operation • When each data store represents data about a single entity • When the system user does not care to see any more detail • When every data flow does not need to be split further to show that data are handled in various ways • When you believe that you have shown each business form or transaction, online display and report as a single data flow • When you believe that there is a separate process for each choice on all lowest-level menu options BCIS 4610, Fall 2008
DFD Balancing • The conservation of inputs and outputs to a data flow process when that process is decomposed to a lower level • Balanced means: • Number of inputs to lower level DFD equals number of inputs to associated process of higher-level DFD • Number of outputs to lower level DFD equals number of outputs to associated process of higher-level DFD BCIS 4610, Fall 2008
Unbalanced DFD This is unbalanced because the process of the context diagram has only one input but the Level-0 diagram has two inputs. 1 input 1 output 2 inputs 1 output BCIS 4610, Fall 2008
Balanced DFD 1 input 3 outputs These are balanced because the numbers of inputs and outputs of context diagram process equal the number of inputs and outputs of Level-0 diagram. BCIS 4610, Fall 2008
Balanced DFD (cont.) These are balanced because the numbers of inputs and outputs to Process 1.0 of the Level-0 diagram equals the number of inputs and outputs to the Level-1 diagram. 1 input 4 outputs BCIS 4610, Fall 2008
Data Flow Splitting A composite data flow at a higher level may be split if different parts go to different processes in the lower level DFD. This remains balanced because the same data is involved, but split into two parts. BCIS 4610, Fall 2008
DFD for a Peer-Review System: Animated Example By Anna Sidorova BCIS 4610, Fall 2008
Description Please draw a context DFD and a level-0 DFD for the following peer-review system: The purpose of the system is to support the pier-review process for a large national conference. Please assume that the editor is a part of the system. • First, the editor receives research papers from AUTHORS and stores them in a file. Names and contact information of the authors are saved in the Potential Reviewer Database. • For each paper, the editor contacts 3 potential REVIEWERS (using information from the Potential Reviewer Database), provides them with a copy of the paper and asks them if they would be willing to review it. • If REVIEWERS agree to review the paper, they submit their reviews to the editor; otherwise, they reply that they would not be able to review the paper. The reviews are also stored. • After the editor receives at least 2 reviews, he makes a decision whether to accept the paper, or to reject it based on the paper and reviewers’ comments. He then notifies the AUTHORS of the decision. • In case of acceptance, the AUTHORS submit a camera-ready copy of the paper to the editor, which is stored for future publication in the conference proceedings. BCIS 4610, Fall 2008
Paper Review Request, Paper Decision Camera Ready Copy Review, Responses Context Diagram Assume the entire system is one process! Who is interacting with our system? What are the data flows between our system and these external entities? 0 Peer-Review System AUTHORS REVIEWERS BCIS 4610, Fall 2008
Cont. Info Paper D2: Pot. Reviewer DB D1: Original Papers Paper … the editor receives research papers from AUTHORS and stores them in a file Names and contact information of the authors is saved in the Potential Reviewer Database. 1.0 R & S Papers & Cont. Info AUTHORS BCIS 4610, Fall 2008