A Factorial Design for Baseball
130 likes | 247 Vues
Explore the fascinating design of baseball and its historical evolution with Dr. Dan Rand at Winona State University. Delve into the origins of the game, whether from Abner Doubleday or Alexander Cartwright, and examine the game's balanced structure. Learn how strategic elements, pitcher-batter dynamics, and field dimensions were optimized over 180 years through trial and error. Uncover how statistical analysis could reshape the game and determine the impact of various factors via factorial experiments—including infield shape, number of bases, strike counts, and more. Let’s play ball!

A Factorial Design for Baseball
E N D
Presentation Transcript
A Factorial Design for Baseball Dr. Dan Rand Winona State University
When it was a game, not a poorly run business • How was baseball designed? • Abner Doubleday in Cooperstown, or Alexander Cartwright in Hoboken, NJ? • Baseball is a beautifully balanced game !
Distance to bases (infield single) Catcher's throw to catch a base stealer Diamond - why not pentagon or oval? Irregular dimensions - home run fences How many outs ? How many strikes ? How many bases ? Foul ball areas Look at balance of baseball that developed in 1800’s:
Baseball strategy is optimization • leftie vs. rightie (pitcher vs. batter) • Pitcher days between starts • Maximize runs - sacrifice, hit and run, swing away
Balance through product modification • 40 years of trial and error experimentation, then • Ball changed in Babe Ruth's time • Mound raised in 1968. • Designated hitter in 1973. • Home run totals of 1996-2001
We could do it all in 1 experiment • If statisticians invented baseball instead of baseball inventing statisticians… • “Build it, and they will come”
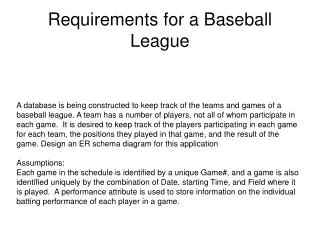
Baseball Design Factors • A - Infield shape/ number of bases - diamond, pentagon • B - outs - 3, 4 • C-Distance to bases - 80 feet, 100 feet • D - foul ball areas - areas behind first, home, and third, or unlimited • E - strikes for an out - 2, 3 • F - fences - short, long • G - Height of pitcher’s mound - low, high
Measurements - trials are innings • # hits, walks, total bases • % infield hits (safe at 1B as % of infield balls in play) • % of outs that are strike-outs • % of outs that are foul-outs • % caught stealing • % baserunners that score • total runs
How many innings ? • Test 7 factors (rules) one-at-a-time, say we need 16 innings at each level • 16 x 7 x 2 (levels) = 224 innings • At what levels are the other 6 factors ? • Full factorial experiment - every combo of 7 factors at 2 levels, 27 = 128 combos • Any factor has 64 innings at its low level, and 64 innings at its high level
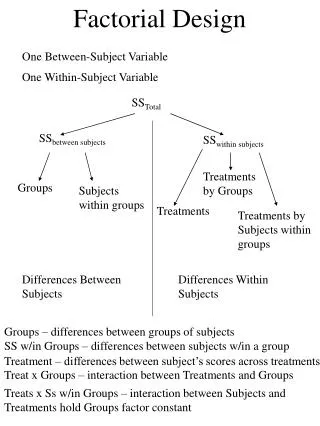
A full factorial gives info about every interaction • Interaction = the phenomenon when the effect of one factor on a response depends on the level of another factor.
One trial of a full factorial • A - Infield shape= 5 sides, 5 bases • B - outs = 3 • C-Distance to bases = 100 feet • D - foul ball areas = unlimited • E - strikes for an out = 3 • F - fences = long • G - Height of pitcher’s mound = low
The power of fractional factorials • For 16 innings, each level, each factor: what can we get out of 32 innings? • Can't run every combination - what do we lose? • We can't measure every interaction separately.
The power of fractional factorials • Needed assumptions: • 3-factor interactions don't exist in this model • 2 2-factor interactions can be pre-determined as unlikely to exist. • Then we only need 32 of the 128 combinations • Let’s play ball !