Download
1 / 12
120 likes | 270 Vues
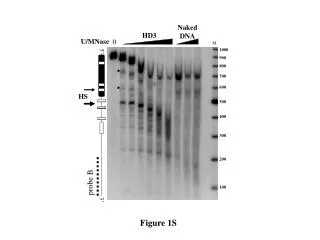
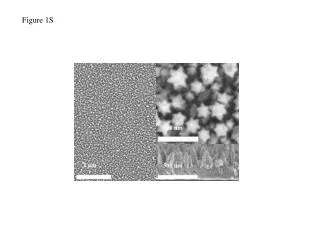
Figure 1S. 200 nm. 2 μ m. 500 nm. Figure 2S-1. a). b ). [Acridine-d 9 +H ] + 189.1. [Acridine+H] + 180.1. S/N. S/N. Mass(m/z). Mass(m/z). (+)- Mode LDI-MS spectra obtained with a) acridine (M.W. = 179) and b) perdeuterated acridine dissolved in toluene . Figure 2S-2.

E N D
Figure 1S 200 nm 2 μm 500 nm
Figure 2S-1 a) b) [Acridine-d9+H]+ 189.1 [Acridine+H]+180.1 S/N S/N Mass(m/z) Mass(m/z) (+)-Mode LDI-MS spectra obtained with a) acridine (M.W. = 179) and b) perdeuteratedacridine dissolved in toluene.
Figure 2S-2 [d-Acridine+H]+ 189.1 [d-Acridine+H]+ 189.1 a) b) S/N S/N Mass(m/z) Mass(m/z) LDI MS spectra were obtained from d- acridine dissolved into d-toluene and b) d-acridine dissolved into d-toluene:d-methanol=1:1.
Supporting Information Figure 3S-1 [M+H]+ S/N S/N S/N [M+H]+ [M+H]+ Mass(m/z) Mass(m/z) Mass(m/z) Steel NSG NSG with 4-MBA [M+H]+ S/N Mass(m/z) NSG with 11-MUDA
Supporting Information Figure 3S-2 S/N S/N S/N [M+H]+ [M+H]+ [M+H]+ Mass(m/z) Mass(m/z) Mass(m/z) Steel NSG NSG with 4-MBA [M+H]+ S/N Mass(m/z) NSG with 11-MUDA
Supporting Information Figure 3S-3 [M+H]+ [M+H]+ S/N S/N S/N [M+H]+ Mass(m/z) Mass(m/z) Mass(m/z) Steel NSG NSG with 4-MBA [M+H]+ S/N Mass(m/z) NSG with 11-MUDA
Supporting Information Figure 4S-1 M•+ M•+ M•+ S/N S/N S/N Mass(m/z) Mass(m/z) Mass(m/z) Steel NSG NSG with 4-MBA M•+ S/N Mass(m/z) NSG with 11-MUDA
Supporting Information Figure 4S-2 M•+ M•+ M•+ S/N S/N S/N Mass(m/z) Mass(m/z) Mass(m/z) NSG NSG with 4-MBA Steel M•+ S/N Mass(m/z) NSG with 11-MUDA
Supporting Information Figure 4S-3 M•+ M•+ S/N S/N S/N M•+ Mass(m/z) Mass(m/z) Mass(m/z) Steel NSG with 4-MBA NSG M•+ S/N Mass(m/z) NSG with 11-MUDA
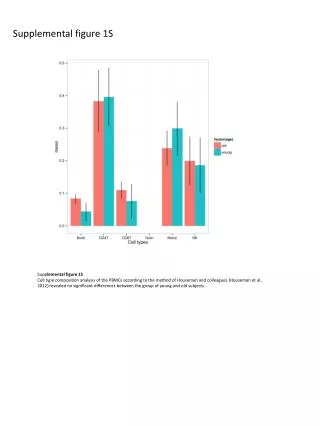
Supporting Information Figure 5S-1 (a) (b) (c) S/N Improvements in (+)-mode LDI MS signal intensities were observed when citric acid and 11-MUDA were used together with a nanostructured gold surface in analyses of (a) acridine, (b) pyrazinecarboxamide, and (c) caffeine. The red and purple bars in (a), (b), and (c) correspond to the NSG surfaces and the NSG surfaces with the 11-MUDA layer and citric acid, respectively.
Supporting Information Figure 5S-2 S/N [M+H]+ S/N [M+H]+ Mass(m/z) Mass(m/z) NSG with 11-MUDA NSG [M+H]+ S/N Mass(m/z) NSG with 11-MUDA and Citric acid
Supporting Information Figure 5S-3 [M+H]+ S/N S/N [M+H]+ Mass(m/z) Mass(m/z) NSG with 11-MUDA NSG [M+H]+ S/N Mass(m/z) NSG with 11-MUDA and Citric acid