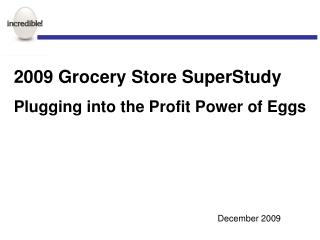

2007 Grocery SuperStudy
E N D
Presentation Transcript
Average Weekly Sales Per Item Sales DAIRY CASE AVERAGE $26.59 Margarine
Sales Weekly Movement Per SKU DAIRY CASE AVERAGE 13.6 Margarine
Sales Percent SKU’s Making Money DAIRY CASE AVERAGE 64% Margarine
Profitability Weekly True Profit Dollars Per SKU DAIRY CASE AVERAGE $5.88 Margarine
Profitability Average Adjusted Gross Margin* DAIRY CASE AVERAGE 35.1% Margarine (*Weighted average gross profit margin after trader and terms dollars)
Profitability True Profit Margin* DAIRY CASE AVERAGE 22.1% Margarine (*Weighted average gross profit margin after trader and terms dollars)
Return on Investment Average Turns PerYear DAIRY CASE AVERAGE 48.9 Margarine
Return on Investment Annual True Profit* Return FOR EVERY DOLLAR OF INVENTORY ON THE SHELF (*After trade, terms, and dairy ABC’s) DAIRY CASE AVERAGE $11.83 Margarine
Return on Investment Current Allocation Recommended Allocation Recommended Space Allocation(vertical feet) Margarine
Space Performance Average Weekly Sales Dollars Per Sq. Ft. Facing DAIRY CASE AVERAGE $69.75 Margarine
Average Gross Profit True Profit Space Performance Average Weekly Profit Per Square Foot DAIRY CASE AVERAGE AGP $24.47 DAILY CASE AVERAGE TP $15.42 Margarine
Space Performance Share of Shelf Space (square feet) Margarine
The incredible edible egg™ • EGGS Drive Profitability & Performance • Strong Sales • Powerful Profitability • Fast Turns • Space that Performs