Download
1 / 40
400 likes | 538 Vues
The 2014-2015 Cardinia Shire Budget outlines key financial strategies, including the implications of recent council rate increases and an analysis of the current debt situation. With a focus on the Council's new civic office and the long-term financial plan, this document also touches on the factors influencing rate calculations based on property valuations. As the population grows, infrastructure and service demands rise, challenging the Council to manage debt responsibly while maintaining community services. Insights from the Australian Centre of Excellence for Local Government on manageable debt are included.

E N D
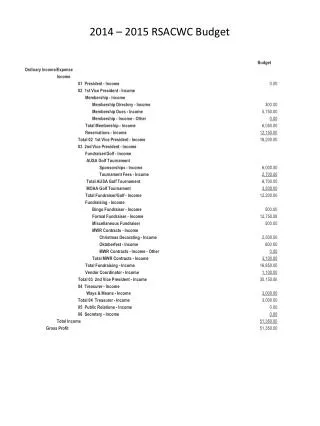
Budget 2014-2015 April 2014
Agenda – Part 1 • Introduction • Recent coverage around council rates and debt • Council New Civic Offices • Rates and valuations • How it is calculated • Analysis
Agenda – Part 2 • Long Term Financial Plan • Principles used (CPI explained) • Future rate increases factored in • Budget Document • Operating result v’s underlying operating result • Capital Works • Challenges facing Cardinia • Questions and hopefully answers
Coverage – Council Rates Information as presented in recent letters to the editor indicated Cardinia had the highest growth rate in rates of the councils listed. Refer to Word Document What the table presented in the media also highlighted was: • In 2003 Cardinia had one of the lowest Council rates in Victoria. • Of the total 62 councils listed 53 (85%) had rates higher • A number of councils were charging in excess of 90% above the rates charged in Cardinia. • In 2013, 32 of the 62 councils listed charge higher rates than Cardinia with 11 (18%) of the councils listed charging in excess of 20% above Cardinia’s rates.
Cardinia Shire Changing? • With this growth in Population the landscape of the shire has changed and services and infrastructure have had to be significantly upgraded to meet the needs of the continually growing population.
Debt • Recent coverage has also stated that council debt is spiralling out of control ? • Council’s current debt is approx. $47m, in 2008/09 this amount was approx. $45m. • As part of it last 2 annual budget processes Council adopted the Debt Management Strategy.
Is council’s Debt Manageable? • The Australian Centre of Excellence for Local Government (ACELG) has released in 2014 significant research on local government finance called 'Debt is Not a Dirty Word: The Role and Use of Debt in Local Government' • Of its findings, the research suggests that the closely managed use of debt by Australian local councils would address infrastructure backlogs and positively support sustainable local communities and organisation performance.
New Office Background • A financial analysis of Council constructing new civic office accommodation against leasing accommodation in 2009 determined that the leasing option was financially more advantageous to Council. • Council had entered into an agreement with Places Victoria to lease the building in Officer for an initial 15 year term with options to extend. • Places Victoria put the offices up for sale as a property with a tenant (Council) and a coffee shop on the ground floor which will be leased by the owner of the building. • The sale of the property presented an opportunity for Council to review the original decision in 2009 to lease the property.
Council New Civic Offices • Cost of New Office $25 Million • Funding's Sources • Debt $20 Million • Council Own Funds
Valuations Cardinia uses the Capital Improved Value as the basis for rating purposes • The Capital Improved Value is the value of the land and any improvements including dwellings, other buildings and landscaping • The Capital Improved Value is generally considered to be an estimation of the market value of a property as at a date set by the Valuer General
Frequency of Valuations • Municipal valuations, for all properties in Victoria, must now be completed every two years. • Council’s valuation contractor conducts a review of property values based on sales of property • The valuations for the 2014/15 budget are based on sales levels as at 1 January 2014
How are rates calculated The "Rate in the Dollar" For a council using only a general rate, the rate in the dollar is calculated as follows: • If council plans to raise the total rate revenue of $10 million, and the total Capital Improved Value of all rateable properties in the municipality is $2,380 billion, then the rate in the dollar is calculated by dividing $10 million by $2,38 billion = 0.42 cents in the dollar.
How are rates calculated • The formula for calculating the rates for an individual property is the valuation multiplied by the rate in the dollar. Councils determine the rate in the dollar as part of their budget process. • For example if the Capital Improved Value of a property is $250,000 and the council rate in the dollar is set at 0.42 cents, the rate bill would be $1050 ($250,000 x 0.0042). ** If council, in a revaluation year decided not to increase rate revenue there would still be changes to rates on individual properties **
Edit your footer in 'Insert>Header and footer' Preliminary Valuations 2014-15 • The total Capital Valuation for all the properties in the shire has only increased by $4.88m, which is an increase of 0.000032%.
Edit your footer in 'Insert>Header and footer' Comparison of rate revenue 2013 and 2014 proposed rates Approx 56%
Edit your footer in 'Insert>Header and footer' Rate calculation issues • As a result of the change in valuations there have been some dramatic shifts in the rate burden. • For example 64.3% of residential properties will have an increase in rates with the balance 35.7% benefitting from a decrease
Edit your footer in 'Insert>Header and footer' Rate calculation issues • 74.9% of Growth Corridor Commercial and Industrial properties will have an increase in rates while 25.1% will have a decrease. • 48.3% of Agricultural Land rate properties will have an increase in rates and 51.7% will have a decrease.
Edit your footer in 'Insert>Header and footer' Simply put over one third of the properties in the shire will be receiving a rate decrease in 2014-15
CPI • The Australian CPI is measured on an acquisitions approach. This approach is considered to be the most suitable approach when the primary purpose of the CPI is as a macro–economic indicator of price inflation affecting households. • CPI is intended to measure the overall inflation in prices of goods and services acquired by Australian households. • CPI basket are determined based on a number of factors. Items: must be representative of purchases made by households; • must have specifically identifiable characteristics that can be observed each period to price to constant quality (e.g. a 420g can of baked beans, or adult general admission to a football game); and • may be those that some people would exclude on moral or social judgements, for example, tobacco and alcohol products will be included in the basket even though many households may never purchase them. Source: http://www.abs.gov.au/websitedbs/webfaq.nsf/home/consumer+price+index+faqs#Anchor7
CPI • Unfortunately as can be seen from the previous slide councils cost base does not reflect the goods and services acquired by an Australian household. • Councils Cost base is driven mainly by the following factors • Wage Inflation • Price/Usage of Utilities (Gas, Electricity, Water etc) • Price/Usage of Raw Materials ( Road Materials etc) • Growth within the shire • Demand for services
Draft 5 Year Financial Plan • In line with the plan adopted as part of the 2013/14 Budget Council achieves an underlying operating surplus over the life of the plan. • Rate increases are factored in at 5.5% and 4.9%. • Reductions in developer contributions factored in. • No Significant increase in Government grants included • Increase in Materials and Services factored in at between 2% and 4% to allow for growth. Page 27 | 11/10/2014 | Edit this in Header and Footer
Draft 5 Year Financial Plan • Table below shows a comparison with the key assumptions of 2013-14 financial plan (F’cast) to the draft budget preparation completed to date as part of the 2013-14 budget process. ** The increase of $20million is for the purchase of the new offices
Rates • 1% increase in rates is equal to approx. $550,000 • Council has been working over the last number of years to close a significant underlying deficit. A proportion of the rate increase each year is allocated to closing this gap. • The continued growth of the shire and the changing needs of the community for different services places additional pressure on council. • Aging infrastructure outside of the growth area requiring significant replacement/upgrade and maintenance yet unable to access elements of government funding more suited to these infrastructure types • $160,000,000 Country Roads and Bridge Program for rural and regional councils to provide $1,000,000 per annum to 40 councils over 4 years.
Underlying Budgeted Result • The underlying result represents the true operating result
Underlying Budgeted Result • The underlying result is an improvement on the budgeted 2013/14 result by $1.10million. • This is equivalent of approx 2.0% rate increase.
Underlying Result • Amount of Operating Expenditure measured against Operating Revenue.
Draft Capital Works 2014-15 • Total of Works program for 2014-15 ($20.58m) of which ($15.47) is funded by council, ($9.56m) from Rates Funding. • $50m invested in Infrastructure renewal over 5 years of which $39m (78%) is funded directly by council. • Approx46% of council funded work directed in the renewal sector. • Approx 38% of Rate Funded Capital Works Spend on Roads and Footpaths
Draft Capital Works 2014-15 • Loan Borrowings to Fund New Major Projects reduce below level of repayments to allow for a reduction on overall debt over the 5 years. • Community grants and Township implementation Funds total $3.5m over 5 years. • Total Capital Works Program $126m over 5 years of which council internally funds $85m.
Challenges Facing Cardinia • Cost Shifting • Unfunded Liability on Precinct Structure Plans • Continued Development and Growth within the Shire • Access to Government Funding
Questions Submitted • Would council please inform the meeting what the rateable ( rates only) incomes, material & services expenses borrowings, servicing the borrowings expenses, total liabilities were reported by council in the various annual report for 2012-13,2011-12,2010-11,& 2009-10 years • Rates Income – Contained in Note 2 of the annual accounts • Material and Services – Contained in Note 10 of the annual accounts • Expense Borrowing - Contained in Note 13 of the annual accounts • Total Liabilities - Contained in Balance Sheet under heading “Total Liabilities” of the annual accounts (Available on Council Website - http://www.cardinia.vic.gov.au/Page/Page.aspx?Page_Id=196) • Would council please inform the meeting what the non expenses carry-over's financial figures were each year at the close of the financial year beginning 30 June for 2012-2013,2011-2012,2010-2011,2009-2010 & report the financial carry over figures as at 31 March. • 2012/13 $23.73m 2010/11 $11.16m • 2011/12 $21.44m 2009/10 $13.7m
Questions Submitted • For each of the years previously listed, how much revenue was council/ ratepayers revenue as a figure(not a percentage) of the carry over's? • 2012/13 Approx $4.6m 2010/11 Not Available • 2011/12 Approx $5.7m 2009/10 Not Available • Would council please explain what the carry over is in the financial terms & why carry over's exist each year after elected councillors vote & approve a budget & the CEO each year allows carry over's to exist when it is the duty under the local government act 1989 to carry out the instructions as set down by the councillors through the 12 month budget, strategic resource plan & council plan. • The carry over represents the value of Budgeted Capital Works “only” committed at the end of the year. These works may have not have commenced or are partially complete. These funds will be utilised once the works have commenced/complete and/or payment falls due. • Based on previous years carry over financial figures, will council fully expense all items listed in 2013-14 year? If no then why not? • Council does not carry forward (accrue) expense items that have not happened to future years as this is not permissible under accounting standards. What Council does reflects the capital dollars budgeted to be completed in the year that have not been fully expended, these funds will need to allowed for to be capitalised in the following period. These funds would show as a actual V’s budget variance.