Understanding the Aggregate Supply Curve and Economic Equilibrium
This chapter explains the Aggregate Supply (AS) Curve, illustrating how it reflects the quantity of goods and services that businesses are willing to produce at various price levels. It discusses the equilibrium point where the AS and Aggregate Demand (AD) intersect, determining real GDP (EGDP) and price levels (PLE). Furthermore, it highlights the self-correcting mechanism during recessions, where wage adjustments and decreased costs lead to shifts in AS, promoting economic recovery. Full employment is defined at the AS and AD intersection where EGDP equals potential GDP (PGDP).


Understanding the Aggregate Supply Curve and Economic Equilibrium
E N D
Presentation Transcript
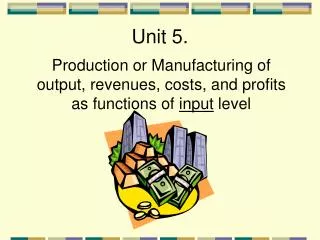
Unit 5 Chapter 28
Aggregate Supply Curve PL AS Aggragate Supply Curve – Shows for each possible price level, the quantity of G & S that all the nation’s businesses are willing to produce. RGDP
Equilibrium of AS & AD AS intersects AD at equilibrium point E, therefore EGDP is at 6000 and PLE is at 100. PL AS 120 110 E 100 90 80 AD 6000 5200 5600 RGDP 6400 6800
Self-correcting Mecahnism • How does it work? • As we get deeper into a recession workers’ need for pay will overwhelm their desire for higher wages so they will accept wage cuts. • We know that when wages decrease, costs decrease, therefore prices will decrease and producers will want to produce more at all level of GDP. This shifts AS out. • When EGDP is less than PGDP the self-correcting mechanism will shift AS out, so that AS intersects with AD at PGDP. AS0 PL AS1 PLE0 PLE1 AD EGDP0 PGDP EGDP1 RGDP
Full Employment • We are at full employment when the AS curve intersects with the AD curve at the point where EGDP is equal to PGDP. PL AS PLE AD PGDP/EGDP RGDP