Photometric methods of analysis
840 likes | 2.9k Vues
Lecture 5. Photometric methods of analysis. Assistant of the pharmaceutical chemistry department Burmas Nataliya Ivanivna e-mail: Natashenka-Burmas@rambler.ru. Plan. Main characteristics of photometric methods of analysis.

Photometric methods of analysis
E N D
Presentation Transcript
Lecture 5 Photometric methods of analysis Assistant of the pharmaceutical chemistry department Burmas Nataliya Ivanivna e-mail: Natashenka-Burmas@rambler.ru
Plan • Main characteristics of photometric methods of analysis. • Molecular–absorption method: an essence, theoretical bases, usage in the pharmaceutical analysis. • Colorimetry: an essence, theoretical bases, usage in the pharmaceutical analysis. • Spectrophotometry : an essence, theoretical bases, usage in the pharmaceutical analysis. • The extraction-photometric analysis (EPMA): an essence, theoretical bases, usage in the pharmaceutical analysis. • Photometric titration: an essence, theoretical bases, usage in the pharmaceutical analysis.
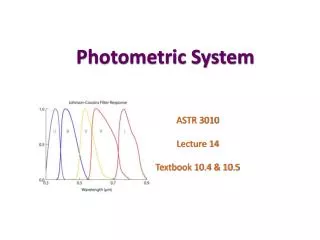
1. Main characteristics of photometric methods of analysis • Molecular–absorption method is based on measurement of absorption by molecules (or ions) substances of electromagnetic radiation of an optical range. • Colorimetry is in which visible light was absorbed by a sample. The concentration of analyte was determined visually by comparing the sample’s color to that of a set of standards using Nessler tubes (as described at the beginning of this chapter), or by using an instrument called a colorimeter. • Photocolorimetry is in which polychromatic light was absorbed by a sample • Spectrophotometry is in which monochromatic light was absorbed by a sample • UV - Spectrum (100-200 to 380-400 nanometers) • Visible spectrum (380-400 to 780-800 nanometers)
Block diagram for a double-beam in-timescanning spectrophotometer with photo of atypical instrument.
Choice of optimum conditions of spectrophotometry: • Choice absorption filters (in photometry) • Choice of absorbance Аoptimal= 0.435 (less error) А = 0.6 – 0.7 • !!!! Not probably to measure absorbance 2 < А < 0.03 • Choice of thickness of a layer- not more 5 сm А = l C • The way of transformation of a defined component in the photometric compound
Sensitivity of photometric definition А = l C Cmin= Аmin / l • А = 0.01 • l = 1 cм • = 1000 thenСmin = 10-5mol/L
The accuracy of photometric definitiondepends from: • Specific features of photometric reaction or photometric compounds • Characteristics of the used device (usually makes 1 - 2 % relative)
Methods of quantitative analysis: 1. A method of calibrationchart !!!The method can be applied, if: • The structure of standard and investigated solutions are similar • The interval of concentration on calibration chart should cover of defined concentration
2. Comparison method (a method on one standard) !! The method can be used if: • Dependence's structure - property is strictly rectilinear and passes through the beginning of co-ordinates. • The concentration of standard and investigated solutions values of analytical signals as much as possible similar and minimum different. • The structure of standard and investigated solutions are as much as possible similar.
3. Method of molar or specific (concentration on % w/w) absorptivity !! The method can be used if: • Strict linearity of dependence structure is an analytical signal is observed. • The analytical device maintains requirements of metrological checking.
4. Method of additives !!! The method can be applied, if: • It is necessary to consider stirring influence of extraneous components of sample on analytical signal of defined substance
Usage of UV – spectroscopy and spectrophotometry in visible spectrum: • Identification and establishment of identity of drugs • Quantitative definition of substance contain • Cleanliness check • The express control of the forged drugs • Research of the structure of new substances
2. Molecular–absorption method: an essence, theoretical bases, usage in the pharmaceutical analysis. Molecular–absorption method is based on measurement of absorption by molecules (or ions) substances of electromagnetic radiation of an optical range. In analytical chemistry, atomic absorption spectroscopy is a technique for determining the concentration of a particular metal element in a sample. The technique can be used to analyze the concentration of over 70 different metals in a solution. Although atomic absorption spectroscopy dates to the nineteenth century, the modern form was largely developed during the 1950s by a team of Australian chemists. They were led by Alan Walsh and worked at the CSIRO (Commonwealth Science and Industry Research Organisation) Division of Chemical Physics in Melbourne, Australia.
Principles The technique makes use of absorption spectrometry to assess the concentration of an analyte in a sample. It relies therefore heavily on Beer-Lambert law. In short, the electrons of the atoms in the atomizer can be promoted to higher orbitals for a short amount of time by absorbing a set quantity of energy (i.e. light of a given wavelength). This amount of energy (or wavelength) is specific to a particular electron transition in a particular element, and in general, each wavelength corresponds to only one element. This gives the technique its elemental selectivity. As the quantity of energy (the power) put into the flame is known, and the quantity remaining at the other side (at the detector) can be measured, it is possible, from Beer-Lambert law, to calculate how many of these transitions took place, and thus get a signal that is proportional to the concentration of the element being measured.
Analysis of liquids A liquid sample is normally turned into an atomic gas in three steps: • Desolvation (Drying) – the liquid solvent is evaporated, and the dry sample remains • Vaporization – the solid sample vaporises to a gas • Atomization – the compounds making up the sample are broken into free atoms.
3. Colorimetry: an essence, theoretical bases, usage in the pharmaceutical analysis. Colorimetry in which visible light was absorbed by a sample. The concentration of analyte was determined visually by comparing the sample’s color to that of a set of standards using Nessler tubes (as described at the beginning of this chapter), or by using an instrument called a colorimeter.
Instruments Colorimetric equipment is similar to that used in spectrophotometry. Some related equipment is also mentioned for completeness. A tristimulus colorimeter measures the tristimulus values of a color. A spectroradiometer measures the absolute spectral radiance (intensity) or irradiance of a light source. A spectrophotometer measures the spectral reflectance, transmittance, or relative irradiance of a color sample. A spectrocolorimeter is a spectrophotometer that can calculate tristimulus values. A densitometer measures the degree of light passing through or reflected by a subject. A color temperature meter measures the color temperature of an incident illuminant.
Two spectral reflectance curves. The object in question reflects light with shorter wavelengths while absorbing those in others, lending it a blue appearance.
4. Spectrophotometry : an essence, theoretical bases, usage in the pharmaceutical analysis. In chemistry, spectrophotometry is the quantifiable study of electromagnetic spectra. It is more specific than the general term electromagnetic spectroscopy in that spectrophotometry deals with visible light, near-ultraviolet, and near-infrared. Also, the term does not cover time-resolved spectroscopic techniques. Spectrophotometry involves the use of a spectrophotometer.
A spectrophotometer is a photometer (a device for measuring light intensity) that can measure intensity as a function of the color (or more specifically the wavelength) of light. Important features of spectrophotometers are spectral bandwidth and linear range of absorption measurement. Perhaps the most common application of spectrophotometers is the measurement of light absorption, but they can be designed to measure diffuse or specular reflectance. Strictly, even the emission half of a luminescence instrument is a type of spectrophotometer. The use of spectrophotometers is not limited to studies in physics. They are also commonly used in other scientific fields such as chemistry, biochemistry, and molecular biology. They are widely used in many industries including printing and forensic examination.
In short, the sequence of events in a spectrophotometer is as follows: • The light source shines into a monochromator. • A particular output wavelength is selected and beamed at the sample. • The sample absorbs light.
4. The extraction-photometric analysis(EPMA) • it ishybridmethod of analysis, in whichcombineextraction (asmethodexcretion, separation and concentrating) andspectrophotometry.
EPMA is used, when: • analyze complex mix • define substance, which is slightly solublein water, but freely solublein select organic solvent • define substance, which is very small quantity into investigated object • define impurities in presence main components • immediately definition investigated component is impossible (light absorption curves both substance bridge along all spectrum) • define colourless substance (use coloured extraction reagent)
Choiceof photometric reactioninEPMA: • Photometric reaction of formationcolouredmetal complexes: Pb2+ + 2H2Dz = Pb(HDz)2+ 2H+ extractioninCHCl3 orCCl4 max= 520 nm(= 7104)
Extraction has extraction efficiency equal R=99,9% is necessary for usage of extraction-photometric method of analysis that It receive by choice: • Solvent-extracting agent • Extraction reagent • Photometric reaction • Chemical factors of extraction (рН, ionic strength, solution composition)
Advantages of ЕPМА: • High sensitivity, because of: - high molar absorptivity of extracted complexes - concentrating of solution by extraction method • High selectivity (pre-award separation, excretion of defined component from mix) • Rapid analysis (in comparison with classical method of precipitation) • Relative simplicity of instrumentation (separatory funnel, spectrophotometer)
Usage of ЕPМА in analysis of pharmaceutical drugs: • define a majority of metal ions (complexing agent) • define a majority of a substance, which is insoluble in water (Trimethoprimum in composition of Biseptolum) • define impurities in drugs (salicylic acid in Aspirinum) • define a biological-active substance in drugs (from medicinal herbs) (heart glycosides, alkaloids, flavanoids, components of essence)
5. Photometric titration • Photometric titration is titration method in which end point of titration (e.p.t) is determined by photometry or spectrophotometry method. • Method isbased on determination e.p.t on jump of solution absorbance in equivalence point.
Condition of titrimetric reaction usage in spectrophotometry is linear relation between absorbance and concentration А = l C
Reactions which is used in spectrophptometric titration: • Acid-base • Complexing • Redox
Calculation of titrant volume: • On titration curve • On system of the equations:
Curves of specrtofotometric titration can be the different form. Their character depends on what components of reaction absorb at the chosen wavelength. А + В АВ Change of solution absorbance is defined by value of molarabsorptivity
Photometrictitrationcurveofsolution Fe2+ by standard solution ofK2Cr2O7 A e.p. V (K2Cr2O7)
Photometrictitrationcurveofsolution KMnO4by standard solution ofFe2+ A e.p. V (Fe2+)
The spectrophotometric titration can be applied when • Titrant or defined substance or product of reactionabsorb light. • If titrant or defined substance or product of reaction don’t absorb light so we use indicators – substances, which don’t absorb light, but form compound with defined substance (АInd), titrant (ВInd) or a reaction product (АВInd) which absorb light
As during titration occur solution dilution in cell (cuvette), than for taking into account of solution volume increase is necessary to plot of photometrictitrationcurve on coordinate Аcorrected – С
Advantages of specrophotometrictitration: • The higher selectivity and possibility definition of several components of sample; • Possibility of titration of the painted solutions; • The higher sensitivity in comparison with classical method of analysis • Possibility of usage of reactions which don’t come to an end in e.p. or reactions which have small equilibrium constant • The higher accuracy