Download
1 / 20
290 likes | 973 Vues
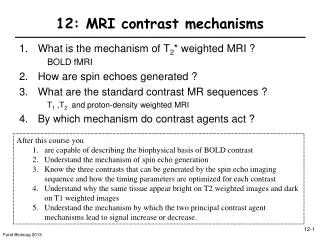
12: MRI contrast mechanisms. What is the mechanism of T 2 * weighted MRI ? BOLD fMRI How are spin echoes generated ? What are the standard contrast MR sequences ? T 1 ,T 2 and proton-density weighted MRI By which mechanism do contrast agents act ?. After this course you

E N D
12: MRI contrast mechanisms • What is the mechanism of T2* weighted MRI ? BOLD fMRI • How are spin echoes generated ? • What are the standard contrast MR sequences ? T1,T2 and proton-density weighted MRI • By which mechanism do contrast agents act ? • After this course you • are capable of describing the biophysical basis of BOLD contrast • Understand the mechanism of spin echo generation • Know the three contrasts that can be generated by the spin echo imaging sequence and how the timing parameters are optimized for each contrast • Understand why the same tissue appear bright on T2 weighted images and dark on T1 weighted images • Understand the mechanism by which the two principal contrast agent mechanisms lead to signal increase or decrease.
MRI: One magnet, many contrast mechanisms Examples of proton density, T1, and T2-weighted images, from the Whole Brain Atlas site at Harvard. Note fluid appearance in all images. Proton density-weighted T2-weighted T1-weighted Multiple sclerosis T1-weighted FLAIR: T2 and T1 weighted (inversion recovery CSF-nulled)[TI=ln2T1(CSF)] T1-weighted[TR=T1(GM)] T2-weighted[TE=T2(CSF)] T2-weighted Large cyst (just cerebrospinal fluid)
T2*-Weighted Images • Venography • Designed to make venous blood (rich in deoxy-hemoglobin) darker than normal tissue (=reduce magnetization in blood) BOLD fMRI=functional MRI Normoxia Hypoxia
Another view on spatial encoding with MRILet’s give it another try … (compare w. Lesson 11) 1. Excitation 3. Frequency encoding TE (For G along x) RF M(w2) = FT{S(t2)} = M(x) S(t2) and M(x) are linked by FT 2. Phase encoding t2 Slice Select (Gz) M(x) is Radon transform measured along the direction of the Gradient G Freq. Encode (G) Measure Radon Transforms along f (as in CT) every TR s (T1 relaxation) (→ sinogram, projection reconstruction, see also central slice theorem) Linear combination of e.g. Gx and Gy: G=(Gx,Gy)=cosfG,sinfG Phase encoding is just frequency encoding in a 2nd time dimension DGy Define t1=nDt: S(t1,t2) M(w1,w2)=M(y,x) 2D FT Gy Phase Encode (Gy) t nDGyt=GynDt Dt
12-1. What is the contrast in gradient echo imaging ?T2* weighting – static dephasing a° Static field imperfection RF Slice Select (Gz) TE Mxy summed over voxel Freq. Encode (Gx) NB. gDB(r)TE=gnDB(r)[TE/n] Phase Encode (Gy) Empirically: Signal NB. T2>T2*
What is the Biophysical basis of T2* changes ?Blood Oxygenation Level Dependent (BOLD) Magnetic susceptibility c: magnetic field in object depends on object properties Deoxy-hemoglobin : paramagnetic oxy-Hb : diamagnetic c<0: diamagnetism (repelling force) c>paramagnetism (attracting force) De-Oxygenated capillary z DB0 in tissue c T2* increases with decreased tissue deHb concentration deoxy~ 1.6 oxy~ -0.3 oxygenated capillary B0 depends on venous architecture in the imaging voxel DB0 in tissue oxyRBC deoxyRBC
2.5 fMRI signal (T2*) 2.0 50 m 1.5 1.0 % signal change 5 0 -5 0 5 10 15 20 25 seconds What does Blood oxygen level dependent (BOLD) contrast measure ?deHbcontent Brain physiology: O2 consumption increases less than Flow during “thinking” What is the consequence? Saturation=%oxy-Hb (deHB=100%-saturation) steady-state hemodynamic response ↑ cerebral blood flow (CBF) : ↓ dHb : ↑ BOLD ↑ cerebral blood volume (CBV) : ↑ dHb : ↓ BOLD capillary bed artery vein arterioles venuoles 1-2 cm
How is brain function imaged using functional MRI (fMRI) ? Brain Activation Analysis Average Difference Image Statistical Significance Image Thresholded Statistical Image Overlay on Anatomic Image T2*-weighted Image Statistical analyses (lots) ON task OFF Time series fMRI signal
How do magnetic susceptibility differences affect T2* ?(B0 imperfections, e.g.air-tissue interface, implants) T2*-weighted image Gradient echo (TE~T2*) Tissue: diamagnetic Air (O2): paramagnetic sinus • How to minimize these effects? • Signal of gradient echo ~ e-TE/T2* • Solution I: Minimize TE Ear canal But, T2-weighing is needed for contrast… Gradient echo (TE<<T2*) implant Solution II: Use SPIN ECHO (see next)
Real (y) Imaginary (x) 12-2. How can a pRF pulse form an echo ? (Hahn) spin echo Observation: When using two RF pulses, echo occurs at twice the time difference between the RF pulses (constant gradient G). Dephasing spin echo 90x 180y 1800 RF pulse (along y) a b c d TE/2 TE/2 Gradient Gy(t) Rephasing a b Magnetization before & after 180: M(sinF , cosF,) → M(-sinF , cosF) (F=gGyyTE/2) d c
Spin echo formation revisited Mathematical formulation • Magnetization at the time points specified: • 1: (0,0,Mz) • rotated by a degrees (RF pulse): • 2: (0,Mzsina,Mzcosa)(0,My,…) • [only consider Mxy, precesses with B =+gGxx • 3: My (cos[(+gGxx)t], sin[(+gGxx)t]) • My [cos(+fx), sin(fx)] • 1800 pulse about x inverts y component of Mxy : • My → - My • 4: My [cos(+fx), -sin(fx)] My [cos(fx),sin(-fx)] • identical to the effect of a negative gradient (see previous lecture) echo formation flip angle a 1800 RF (B1) 1 2 3 4 TE Gx Signal S decays exponentially due to T2 or T2* relaxation S~Mxy T2 (Spin echo) Unavoidable (B0 is never homogenous in space) exploited in BOLD fMRI T2* (gradient echo) TE
The spin echo imaging sequence 180° 90° RF Slice Select (Gz) TE Derivation of signal S Mxy: Proton densityr M0 Freq. Encode (Gx) Phase Encode (Gy) Signal S Repeated every TR seconds
12-3. What are the basic MRI contrast mechanisms ?I. Proton density weighted MRI Minimize effects of relaxation: • Short TE:minimize influence of T2 long TR:minimize effect of T1 differences Imaging thenumber of protons per voxel Tissues with higher spin density (e.g., fat, CSF) have higher image intensity Water content: only ~70-100% (poor contrast)
II. How is T2 contrast generated ?contrast based on differences in T2 T2 weighting: long TR→ reduced T1 effects longer TE : accentuate T2 differences • What TE is optimal? • Find TE at which Mxy is most strongly affected by T2 differences • Solution (variational calculus, Lecture 1): • Find TE at which dMxy/dT2=maximal • For tissues with different T2a and T2b: Use TE between the two T2 values. TE = T2
III. How is MRI T1-weighted ?contrast based on differences in T1 T1 weighting: short TE→ minimize T2 effects short TR→ accentuate T1 effects • use short TR to maximize the differences in longitudinal magnetization during the return to equilibrium • Tissues with shorter T1 have higher image intensity • Question: When is the signal maximally sensitive to changes/differences in T1? Answer: TR=T1 (see 9-17)
Ex. r, T1 and T2 weighted MRISpin echo images T1 weighted rweighted T2 weighted Note fluid appearance in all images. TR 510ms TE 14ms TR 4500 ms TE 15ms TR 4500ms TE 105ms T1-weighted MRI of the knee fat has short T1 compared to muscle lipoma Same subject NB. Water in tissues: short-T1↔ short T2 long-T1↔ long T2 bone fat
Ex. T2-weighted MRI of cancer(cancer tissue water has long T2) nude mouse with xenograft tumor (D282 tumor) T2-weighted T1-weighted Colon carcinoma metastases (liver) TR = 500 ms TE = 14 ms TR = 2 s TE = 40 ms T1-weighted post-contrast T2-weighted
12-4. What are the mechanisms of MRI Contrast Agents ?Relaxation times are shortened by relaxivityr1, r2* 1) T1 – Paramagnetic agents • Mechanism: (interaction with water & molecular tumbling) Contrast agent w. concentration. [CA] shortens T1: T1CA brighter signal on T1-weighted images Example: [CA]=1mM, r1=3 mM-1s-1 and T1=1s: 1/T1CA=1+3=4 → T1CA=0.25s S~Mz T1 (T1-weighted) (TE<<T2) TR 2) T2 – Paramagnetic and Susceptibility agents [T2* – Susceptibility agents] Reduced (removed) signal on T2 or T2*-weighted images T2* (gradient echo) S~Mxy Example: [CA]=1mM, r2*=50 s-1mM-1 and T2*=50ms: 1/T2*CA=20+50=4 → T2*CA=14ms T2*CA TE
Examples I • MRI contrast agents • Typically restricted to blood • Ideal to image vessels • Leaky vessel walls • Tumours • Inflammation Gd Enhanced Brain Malignancy pre post MRI of mouse trunk Negative Contrast From Iron Oxide (T2* agent)
Examples II: Intracellular contrast agentsMn-enhanced MRI (MEMRI) Mn-enhanced MRI (synaptic activity imaging) • Manganese (paramagnetic): • Transported by Ca channels • Shortens T1 Imaging stem cells, transplanted cells Cells pre-loaded with contrast agent Transplanted Langerhans islets in liver