Download
1 / 12
120 likes | 233 Vues
Learn how to optimize the number of channels for better resolution of reflectivity curves and overcome data inconsistency issues in Mantid software. Explore angle corrections and spectrum alignment techniques.

E N D
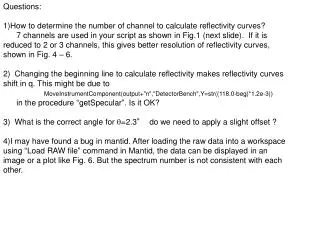
Questions: • How to determine the number of channel to calculate reflectivity curves? • 7 channels are used in your script as shown in Fig.1 (next slide). If it is reduced to 2 or 3 channels, this gives better resolution of reflectivity curves, shown in Fig. 4 – 6. • 2) Changing the beginning line to calculate reflectivity makes reflectivity curves shift in q. This might be due to • MoveInstrumentComponent(output+"n","DetectorBench",Y=str((118.0-beg)*1.2e-3)) • in the procedure “getSpecular”. Is it OK? • 3) What is the correct angle for q=2.3° do we need to apply a slight offset ? • I may have found a bug in mantid. After loading the raw data into a workspace using “Load RAW file” command in Mantid, the data can be displayed in an image or a plot like Fig. 6. But the spectrum number is not consistent with each other.
1st angle (q=0.5°) Fig. 1 Images of straight through beam 2nd angle (q=1.6°) 10 mA, Slit area=10 (#4986) 116 110 Channel number 3rd angle (q=2.3°)
Fig. 2 Profiles of straight through beam nr.get.mergeThroughBeams("05TB",[4985],[4986],0.03,7.0,106,112) nr.get.mergeThroughBeams("16TB",[4987],[4988],0.03,7.0,106,112) nr.get.mergeThroughBeams("23TB",[4989],[4990],0.03,7.0,106,112) Slit conditions
Fig. 3 Images of reflected beam 2nd angle (q=1.6°) 1st angle (q=0.5°) 116 110
Fig. 4 Profiles of reflected beam (1st angle). 3ch data (107-109) looks fine
Fig. 4 Profiles of reflected beam (2nd angle). 4ch data (107-110) looks fine
Fig. 5 Combined reflectivity curves 1st / 2nd 9ch / 9ch 3ch / 4ch
Fig. 6 3D plot and 2D plot of a workspace loaded by Load RAW File command. Spectrum number seems not to be consistent with each other.
Reflectivities of bilayer samples (spin-coat, F8BT/diL216/Si)