
3. Sampling (ELO)
E N D
Presentation Transcript
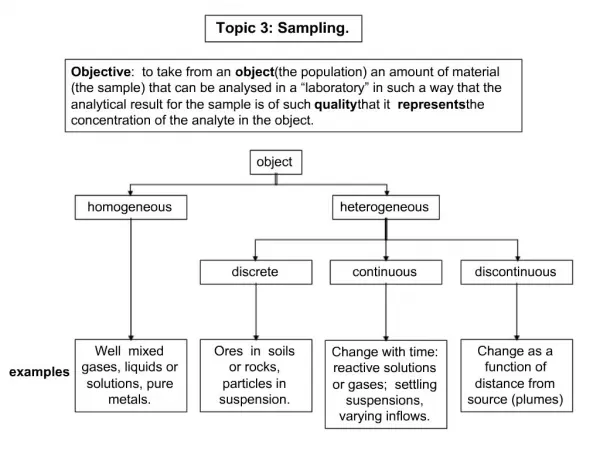
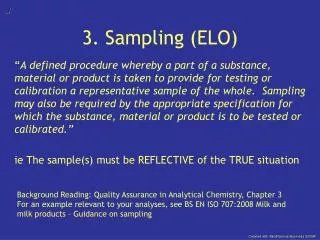
3. Sampling (ELO) “A defined procedure whereby a part of a substance, material or product is taken to provide for testing or calibration a representative sample of the whole. Sampling may also be required by the appropriate specification for which the substance, material or product is to be tested or calibrated.” ie The sample(s) must be REFLECTIVE of the TRUE situation Background Reading: Quality Assurance in Analytical Chemistry, Chapter 3 For an example relevant to your analyses, see BS EN ISO 707:2008 Milk and milk products – Guidance on sampling
Sampling Strategies (1) Depend on: • Types of parent material • Homogeneous or heterogeneous • Static (stable and contained) or dynamic (cannot be resampled) • Concentration • Trace (prone to heterogeneity and contamination) • Principal component (% uncertainty much lower) • Packaging • Bulk (eg a silo) • Packaged (eg cornflakes) • Items (eg tablets) • Results required • Quantitative (how much) • Qualitative or compliance (yes/no answer) – “acceptance sampling”
Sampling Strategies (2) • Criteria? • attributes (x% of items must conform) • variables (a specified average and sd) • Selective sampling OK? (eg fruit but not stone)? Overall strategy determined by purpose: • Client requirements • Statutory requirements (legal obligations) • Trade definitions (contractual)
Types of Sampling • 100% sampling (all items monitored) • Probability sampling (statistical chance of being representative) • Judgement (guided by the reason for analysis) • Quota (stratified judgement sampling) • Convenience (as and when available) • Non-probability sampling (selective)
Sample size and number Must be specified as part of the method. • Sample Size • Enough for method • Enough to be reflective (esp for trace analysis) • Sample number • enough to reduce uncertainty (esp that from sampling) to acceptable levels
Sampling Uncertainty Overall uncertainty in analysis is composed of: • Measurement uncertainty (quantifiable using standards) • Sample uncertainty which is caused by • Population uncertainty (real wobble in the system) • Sampling uncertainty (due to the process of collection) Sampling uncertainty must be reduced until: • it does not obscure population uncertainty • the resource required outweighs the risk of an incorrect result More samples and smaller particles reduce sampling uncertainty See also CH250:1 Causes of uncertainty
How many samples are needed? Number of samples needed can be estimated by rearranging the equation for confidence intervals: • n is the number of samples • t is Student’s t (routinely approximated to 2 for 95% confidence) • s is the standard deviation for the method (measured using reference standards, and inter-laboratory trials) • E is the size of the effect that must be measurable (in the same units as s).
Number of samples - worked eg Cadmium concentrations in soil were measured at a brownfield site during preliminary surveying. The mean ± standard deviation were (16 ± 4) ppm. a) Calculate the number of samples required to obtain a total uncertainty of 20%. b) How many samples would be required to reduce this uncertainty to 10%?
Number of samples - Answer Cadmium concentrations in soil were measured at a brownfield site during preliminary surveying. The mean ± standard deviation were (16 ± 4) ppm. a) Calculate the number of samples required to obtain a total uncertainty of 20%. Between 6 and 7, assuming t=2 b) How many samples would be required to reduce this uncertainty to 10%? 25, assuming t=2
How big should the sample be? There are various statistical calculations based on a) the proportion of analyte present and b) the particle size to approximate sample mass needed. The simplest of these is as follows: Where Ks is the sampling constant, m is the mass in g and %CV is the Coefficient of Variation (which must be calculated from measurements on several test portions).
How big should the sample be? Once Ks is known the equation can be rearranged to calculate: a) The test portion mass (m) required to achieve a specified %CV b) The likely %CV from a given test portion mass