Download
1 / 26
270 likes | 412 Vues
Neighborhood Deprivation and the Retail Food Environment in a US-Mexico Border Urban Area. Teresa M. Anchondo, MPH, The University of Texas at El Paso - Department of Public Health Sciences

E N D
Neighborhood Deprivation and the Retail Food Environment in a US-Mexico Border Urban Area Teresa M. Anchondo, MPH, The University of Texas at El Paso - Department of Public Health Sciences Joe Tomaka, Ph.D., Associate Professor: University of Texas at El Paso - Department of Public Health Sciences
Obesity Trends Among U.S. Adults Source: Behavior Risk Factor Surveillance System, 2012
Socioecological Framework Source: Caprio et al., 2008
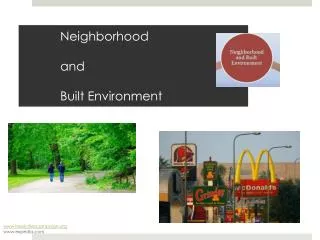
Key Concepts • Neighborhood Deprivation– unmet basic human needs due to a lack of resources at a neighborhood level, such as income, housing, health and education (Ball et al., 2008) • Retail Food Environment – different types of food establishments within a given area, such as supermarkets, grocery stores, and convenience stores (Ford & Dzewaltowski, 2008)
Relationship between Neighborhood Deprivation and the Retail Food Environment • Deprivation Less Access to the Retail Food Environment • Zenket al., 2006 • Powell et al., 2007 • Ford et al., 2008 • Larson et al., 2009 • Deprivation Greater Access to the Retail Food Environment • Sharkey & Horel, 2008
Purpose and Hypothesis • This study examined the association between neighborhood deprivation and the retail environment in El Paso County • Hypothesis 1 – High levels of neighborhood deprivation will be inversely associated with the availability of supermarkets
Methods • Neighborhoods Census Tract • US census data from 159 census tracts that comprise El Paso County Source: U.S. Census Bureau, 2011 American Community Survey
Methods • Single index of Neighborhood Deprivation • US Census variables • Median household income • % Below poverty level • % Female Head of Household • % < 9th grade education • % with no access to a vehicle • % Household crowding • % With public assistance income • Indices (Messer et al., 2006) • One Index divided into quartiles
Store Identification and Classification • InfoUSA Database (www.infogroup.com) • Addresses for all retail stores in El Paso • Large Chain Supermarkets • Small Grocery Stores • Specialty stores (Fruit, Vegetable, and Meat Markets) • Convenience Stores • Variety (dollar stores, pharmacies) • Liquor Stores • N for each census tract • Geographic Information systems (GIS) technology ArcGIS v. 10.0 was used to spatially display and analyze data at the tract level.
Chain Supermarkets • Chain supermarkets were identified on basis of name recognition. • Traditionally, supermarkets are larger stores that provide healthy foods at a lower cost
Grocery Stores • Generally smaller in size & stock fewer foods compared to supermarkets • Wide variety in the quality of foods offered.
Specialty Stores • Fruit and vegetable, meat, bakeries • May offer culturally-appropriate foods for maintaining traditional diet.
Convenience Stores Provide a limited variety of foods associated with a healthy diet.
Analysis • Zero-order Correlations between Neighborhood Deprivation and frequency of various store types of food stores. • Analysis of Variance (ANOVA) was used to examine non-linear trends.
Results Raw: F(3,156) = 2.09, p = .10 Adjusted: F(3,156) = 2.56, p = .057
Results Raw: F(3,156) = 7.2, p ≤ .001 Adjusted: F(3,156) = 5.2, p = .002
Results Raw: F(3,156) = 3.9, p = .01 Adjusted: F(3,156) = 2.74, p = .046
Results Raw: F(3,156) = 2.4, p = .074 Adjusted: F(3,156) = .39, p = .76
Why the Exception? • Sharkey & Horel, 2008 assessed the food environment in a 6-county rural region in Texas. • The results indicated that the most deprived neighborhoods with the highest minority composition had better access to all types of food stores. Possible reasons why things are different Culture - El Paso is predominately Hispanic which may provide support for small grocery stores that tend to offer ethnically appropriate foods. Safety - El Paso currently has the lowest crime rate among American cities with a population over 500,000 which allows for the ease of access to the stores. Proximityto the U.S. Mexico Border - allows people from Mexico to cross over into El Paso to shop which may support smaller grocery and specialty stores
Conclusions • Small grocery stores and specialty stores were positively correlated with neighborhood deprivation. • High deprivation neighborhood contained many supermarkets which is less consistent with previous research findings. • The relatively high availability of small grocery and specialty stores may provide culturally appropriate foods.
Acknowledgments • We would like to express our deepest appreciation and gratitude to our colleague and mentor, the late Dr. Paula Ford. This would not have been possible without you.