Atmospheric chemistry
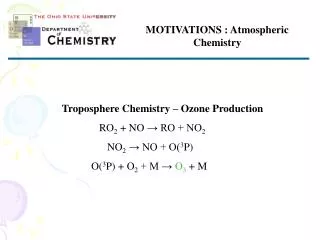
Atmospheric chemistry. Day 2 Stratospheric chemistry. O 2 O( 3 P) + O( 3 P) Threshold = 242 nm O 2 O( 3 P) + O( 1 D) Threshold = 176 nm. UV absorption spectrum of O 3 at 298 K . Hartley bands. Small but significant absorption out to 350 nm (Huggins bands).

Atmospheric chemistry
E N D
Presentation Transcript
Atmospheric chemistry Day 2 Stratospheric chemistry
O2 O(3P) + O(3P) Threshold = 242 nm O2 O(3P) + O(1D) Threshold = 176 nm
UV absorption spectrum of O3 at 298 K Hartley bands Small but significant absorption out to 350 nm (Huggins bands) Very strong absorption Photolysis mainly yields O(1D) + O2, but as the stratosphere is very dry (H2O ~ 5 ppm), almost all of the O(1D) is collisionally relaxed to O(3P)
O3 altitude profile measured from satellite At the ground [O3] ~ 10-100 ppb, in the stratosphere [O3] ~ 5-10 ppm
Total column amount of ozone measured by the Total Ozone Mapping Spectrometer (TOMS) instrument as a function of latitude and season Can we account for the distribution of ozone?
Timescale Slow (J is small) Fast < 100 secs Fast ~ 1000 s Slow (activation barrier)
[O] < < [O3] [O]x = [O3] + [O] ~ [O3] Odd oxygen ( at least 99% of odd oxygen is O3 – below 50 km)
Altitude/km z J1 • J1 = rate of O2 photolysis (s-1) • J3 = rate of O3 photolysis (s-1) • Graph shows the altitude dependence of the rate of photolysis of O3 and O2. Note how J1 is very small until higher altitudes • The ratio J1/J3increases rapidly with altitude, z • As pressure exp (-z) then [O2]2 [M] decreases rapidly with z J3 J1 This balance results in a layer of O3 J3
HOW GOOD IS THE CHAPMAN MECHANSIM? The Chapman mechanism overpredicts O3 by a factor of 2. Something else must be removing O3 (Or the production is too high, but this is very unlikely) Altitude / km
Catalytic ozone destruction X is a catalyst and is reformed The loss of odd oxygen can be accelerated through catalytic cycles whose net result is the same as the (slow) 4th step in the Chapman cycle Uncatalysed: O + O3 O2 + O2 k4 Catalysed: X + O3 XO + O2 k5 XO + O X + O2 k6 Net rxn: O + O3 O2 + O2 X = OH, Cl, NO, Br (and H at higher altitudes) Reaction (4) has a significant barrier and so is slow at stratospheric temperatures Reactions (5) and (6) are fast, and hence the conversion of O and O3 to 2 molecules of O2 is much faster, and more ozone is destroyed. Using the steady-state approximation for XO, R5=R6 and hence k5[X][O3] = k6[XO][O] Rate (catalysed) / Rate (uncatalysed) = R5/R4 = k5[X][O3]/k4[O][O3]= k5[X]/k4[O] Or Rate (catalysed) / Rate (uncatalysed) = R6/R4 = k6[XO][O]/k4[O][O3]=k6[XO]/k4[O3]
k5 k6 k4 Note that rate coefficients for X+O3 (k5) and XO+O (k6) are much higher than for O + O3 (k4)So don’t need much X present to make a difference
HOx Altitude z / km Maximum in the O3 mixing ratio is about here Fraction of odd oxygen loss
CFC’s are not destroyed in the troposphere. They are only removed by photolysis once they reach the stratosphere.
Data from NOAA CMDL Ozone depleting gases measured using a gas chromatograph with an electron capture detector (invented by Jim Lovelock) These are ground-based measurements. The maximum in the stratosphere is reached about 5 years later 45 years 100 years Why are values in the N hemisphere slightly higher?
Removal of the catalyst X. Reservoir is unreactive and relatively stable to photolysis. X can be regenerated from the reservoir, but only slowly. [X] is reduced by these cycles. For Cl atom, destroys 100,000 molecules of O3 before being removed to form HCl “Do nothing” cycles Ox is not destroyed Reduces efficiency of O3 destruction
Interactions between different catalytic cycles Reservoir species limit the destruction of ozone ClONO2 stores two catalytic agents – ClO and NO2
Effects of catalytic cycles are not additive due to coupling Mechanism Ozone Column (Dobson units) Chapman only (C) 644 C + NOx 332 C + HOx 392 C + ClOx 300 C + NO x+ HOx + ClOx 376 Coupling to NO leads to null cycles for HOx and ClOx cycles Increase of Cl and NO concentrations in the atmosphere has less effect than if Cl or NO concentrations were increased separately (because ClOx and NOx cycles couple, hence lowering [X])
Bromine cycle Br + O3 BrO + O2 Cl + O3 ClO + O2 BrO + ClO Br + ClOO ClOO Cl + O2 Net 2O3 3 O2 Br and Cl are regenerated, and cycle does not require O atoms, so can occur at lower altitude Source of bromine : CH3Br (natural emissions from soil and used as a soil fumigant) Halons (fire retardants) Catalytic cycles are more efficient as HBr and BrONO2 (reservoirs for active Br) are more easily photolysed than HCl or ClONO2 But, there is less bromine than chlorine Bromine is very important for O3 destruction in the Antarctic stratosphere where [O] is low
October ozone column, Halley Bay, Antarctica • TOMS (on Nimbus 7 satellite) o Dobson spectrophotometer
Total Ozone Mapping Spectrometer (TOMS) Monthly October averages for ozone, 1979, 1982, 1984, 1989, 1997, 2001 Dobson units (total O3 column)
October 2000 “For the Second time in less than a week dangerous levels of UV rays bombard Chile and Argentina, The public should avoid going outside during the peak hours of 11:00 a.m. and 3:00 p.m. to avoid exposure to the UV rays” Ushaia, Argentina The most southerly city in the world
At 15 km, all the ozone disappears in less than 2 months This cannot be explained using gas-phase chemistry alone US Base in Antarctica
Steps leading to ozone depletion within the Antarctic vortex ClO+BrOCl+Br+O2
Simultaneous measurements of ClO and O3 on the ER-2 Late August 1987 September 16th 1987 Still dark over Antarctica Daylight returns The “smoking gun” experiment – proved the theory was OK
Simultaneous measurements of ClO and O3 on the ER-2 Late August 1987 September 16th 1987 Still dark over Antarctica Daylight returns The “smoking gun” experiment – proved the theory was OK
Ozone loss does appear in the Arctic, but not as dramatic Some years see significant depletion, some years not, and always much less than over Antarctica Above Spitzbergen