Download
1 / 18
190 likes | 311 Vues
The house believes that positive GC NAAT results in low prevalence populations should be confirmed. False positive GC test results adversely impact patients. False positive NAATs are real and result in low positive predictive values in low prevalence populations.

E N D
The house believes that positive GC NAAT results in low prevalence populations should be confirmed.
False positive GC test results adversely impact patients. • False positive NAATs are real and result in low positive predictive values in low prevalence populations. • There are quality assurance issues with NAATs at both the local laboratory and the manufacturer level. Confirmation of positive NAATs in low prevalence populations is a good QA tool. • If applied appropriately, confirmatory testing can be cost effective.
NAAT Confirmation Approaches • Second specimen, different gene target, different assay. • Same specimen, different gene target, different assay. • Repeat the original test with the same specimen. • Same specimen, same assay, different gene target.
Documentation of False Positive GC NAAT Results in Hawaii • Population prevalence: • GC – 1.06%, CT – 4.13% • Cases – 5 monogamous women • 3 asymptomatic and 2 with BV. • All reexamined and GC negative by TMA and culture. • 4 partners examined and all negative for GC. Katz AR, et al. Clin Infect Dis 2004:38 (electronically published on 2/27)
Documentation of False Positive GC NAAT Results in Hawaii • Impact • All women experienced emotional stress. • One woman ended monogamous relationship. • One severed long time relationship with care provider. • Actions • Note concerning possibility of FPs added to all GC positive reports. • Web site to provide detailed information for clinicians. • Letter from health department to all Hawaiian physicians concerning importance of sexual histories and explaining concept of PPV. Katz AR, et al. Clin Infect Dis 2004:38 (electronically published on 2/27)
Gonorrhea — Positivity among 15-24 year old women tested in family planning clinics by 2000
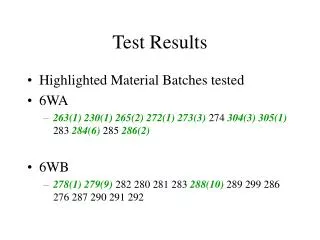
CT and GC Prevalence in High School Girls Prevalence rates * Cohen, DA, et al. Pediatrics 1999; 104: 1281 ** Kent C., et al. STD 2002; 29: 373
Why are we testing for GC in low prevalence populations? • Manufactures offer bundled CT and GC assays together at a cost that is often no more than the cost of a CT assay alone. • Up until recently third party payers have been reimbursing providers for each organism separately.
Variability in CT NAAT Results Between Testing Sites in the CDC 455 Study Johnson RE, et al. J Clin Microbiol 2000;38:4382.
Documentation of False Positive GC NAAT Results in a QA Project • 96 laboratories participated; all NAAT systems represented. • Three negative urines included in panel. • One false positive result was reported for two of these by the different laboratories. • Conclusion: Individual laboratory error resulted in FP rates of about 1%. Verkooyen RP, et al. J Clin Microbiol 2003;41:3013.
Lessons learned from Abbott Laboratory’s LCx assay experience.
COBAS AMPLICOR Gray Zone Phenomenon • Gene target found in respiratory Neisseria species. • False positives characterized by optical density (OD) readings of 0.2 to 3.5 (gray zone.) • Initial results in the gray zone are repeated in duplicate. 2/3 results with ODs ≥2 are classified as positive. • Specificity based on initial result ranged from 96.2 to 98.9. Retesting algorithm increased specificity to 98.5-99.9. Van der Pol B, et al. J Clin Microbiol 2001;39:3092.
Reproducibility of 3 GC NAATs Kappa Scores Van der Pol B., et al. Proceedings of the 10th International Symposium on Human CT Infections. 2002; 401-4.
Cost of Confirming Positive GC NAATs in Low Prevalence Populations • 100 CT/GC assays at $14 each = $1,400. • 3 GC confirmation assays at $16 each = $48. • Total cost for screening and confirmation is $1,448, representing a 3.4% increase compared to screening alone.
Summary • False positive NAAT test results are a fact of life even under optimal conditions. • Such results have an adverse impact on patients. • NAATs are complex; variation in individual laboratory performance is inevitable.
Summary • NAAT kit manufacturing problems are always a possibility and not all NAATs perform the same. • It follows from 3. and 4. that laboratories should have additional QA measures in place. • Same assay, alternate target confirmation of positive GC NAAT results in low prevalence populations is not expensive.
Conclusion “Screening can promote or impair health, depending on its application. Unlike a diagnostic test, a screening test is done in apparently healthy people, which raises unique ethical concerns. Even very good tests have poor predictive value positive when applied to low-prevalence populations.” Grimes DA and Schultz KF Lancet 2002; 359: 881