Download
1 / 32
370 likes | 704 Vues
Australia and New Zealand. Business Prospects. Keith Kirkham – A/Senior Commercial Officer CS Australia/NZ. Outline. The Good Story The AUSFTA Some Key Opportunities in Australia and New Zealand How to Begin. Differences Obvious & Subtle. Counter-seasonal

E N D
Australia and New Zealand Business Prospects Keith Kirkham – A/Senior Commercial Officer CS Australia/NZ
Outline • The Good Story • The AUSFTA • Some Key Opportunities in Australia and New Zealand • How to Begin
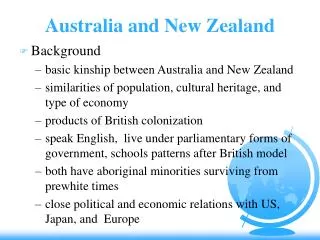
Differences Obvious & Subtle • Counter-seasonal • Multicultural with European patterns • Indigenous Supply • Influence in the Region
Australia Population Density • Australia is the 7th most urbanized country in the world. More than 80% of population in this ring
The Good Story • Strong, Resilient Economy • Ease of Doing Business • Purchasing Power • A-US Free Trade Agreement
The Economy • 15th year expansion • Low Inflation/Low unemployment • High Capacity Utilization and Capex • Forecast 3.25% growth
America’s Strong Trade Position • American exports to Australia $17.7 billion in 2006 • U.S. trade surplus with Australia approx US$8 billion • U.S. is major foreign supplier;15.2% of the import market
The Market Drivers: Australia • Commodity Prices: strong Asian demand • Infrastructure spending to add capacity • Trading partner growth
Drought • Shaving almost 1% off GDP growth • During high commodity prices • Crop yields 50% or less than normal • Water use and major projects
Market Drivers: New Zealand • Commodity Prices (e.g. dairy) • F/X • Trading Partners’ Economies • In Migration • Tourism
New Zealand Risks • Oil prices • Strong NZ $ drags export economy • Highly Leveraged consumers shift demand from consumer to industrial spending
Australia Risks • Oil prices • Continued Drought • Labor shortage/wage inflation
Strong A$ and NZ$ Effects • Drags export growth and revenue in F/X sensitive areas • Increases U.S. exporter price advantage, Aussie and Kiwi purchasing power
Ease of Doing Business • Sophisticated Market • World Class infrastructure • Politically stable • Excellent IPR regime • Transparent processes • Technology intensive
Purchasing Power: Getting Richer Quicker • Terms of trade rose 13% • Real Gross Domestic Income (GDI) 5.2% • National income growth among highest in the developed world (higher than US or Japan)
Australia-U.S. Free Trade Agreement Major Benefits for U.S. Companies • Tariff Reduction • eliminated on 99% of manufactured goods • eliminated all agricultural tariffs, distilled spirits • Intellectual Property (strengthened protection) • Access to Australian Government procurement • Investment access improved
AUSFTA vs NAFTA • Like NAFTA • Uses rules of origin and calculations for regional value • Unlike NAFTA • Onus on importer not exporter • No prescribed certificate form
Qualifying U.S. Goods An Originating Good Must Be: • Wholly obtained or produced entirely in the United States (e.g vegetables harvested in U.S.) • Produced in the United States wholly from other originating materials from either Australia or the United States; or • Produced in the United States partly from non-originating materials, but meeting the requirements of the origin rules
Australia Financial Services • Total turnover in financial markets A$68.9 billion, • Largest, most liquid stock market in Asia-Pacific, after Japan • Australia's investment fund asset pool the largest in Asia, 4th largest in the world • Funds under management reached A$839 (US$648) billion in March 2005; and will reach A$2.5 trillion by 2015.
Australia Infrastructure Projects Medical Devices Information Technology Services Construction Machinery Oil and Gas Field Machinery Water Technologies New Zealand Infrastructure Projects Power Generation/Electricity Supply Chain technologies (RFID) Agricultural applications Food Processing and Packaging Opportunities
Agribusiness Opportunity – Fieldays 2007 • New Zealand Fieldays 115,000 visitors and 1,000 exhibitors. • U.S. Pavilion • Event runs June 13 – 16, 2007 Hamilton, New Zealand • CS New Zealand’s Webinars • www.fieldays.co.nz
How to Begin • Assess Market • Determine Modifications to Product Business Model if Necessary • Determine Appropriate Scale • Market Entry Plan; Find Distributor • Promotional Opportunities (e.g. trade shows)
Contact Us U.S. Commercial Service U.S. Consulate General 19-29 Martin Place, 59 MLC Centre Sydney NSW 2000 http://www.BuyUSA.gov/australia Tel. 61-2-9373-9205 Fax. 61-2-9221-0573