Tuberculosis Situation in the EU/EEA: Findings from ECDC and WHO Joint Surveillance Report
230 likes | 247 Vues
This report presents the findings from the ECDC and WHO/EURO joint tuberculosis surveillance report in 2011. It includes data on TB notification rates, proportion of confirmed cases, TB in children, foreign origin cases, extrapulmonary TB, drug resistance, and more.

Tuberculosis Situation in the EU/EEA: Findings from ECDC and WHO Joint Surveillance Report
E N D
Presentation Transcript
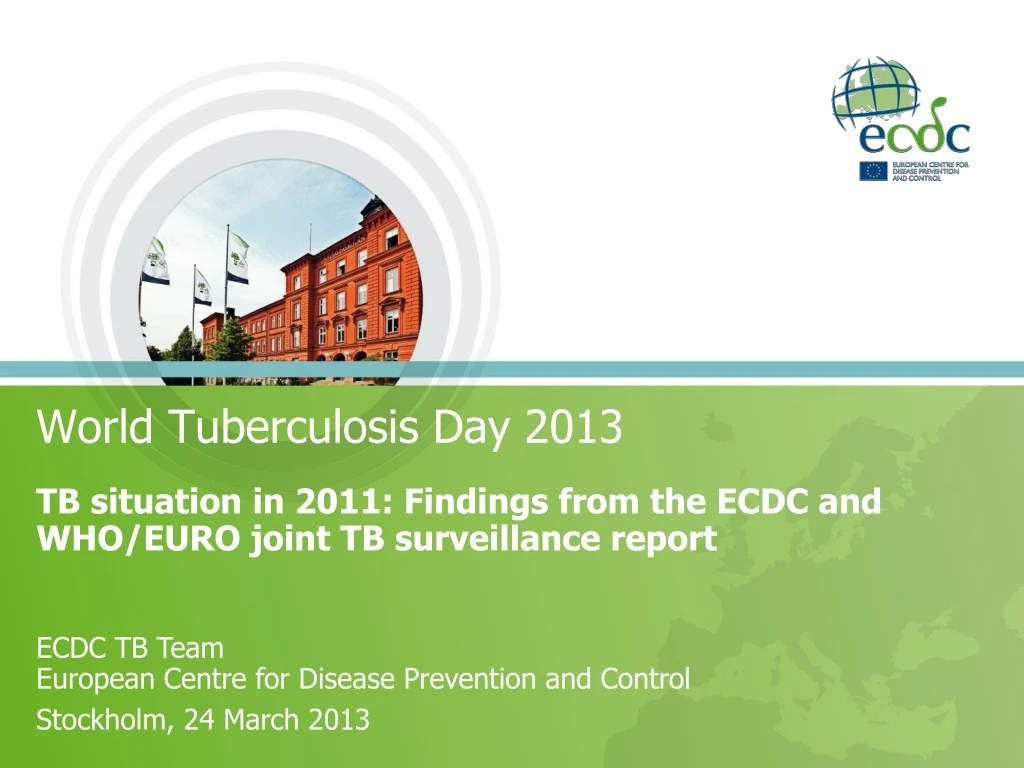
World Tuberculosis Day 2013 TB situation in 2011: Findings from the ECDC and WHO/EURO joint TB surveillance report ECDC TB TeamEuropean Centre for Disease Prevention and Control Stockholm, 24 March 2013
TB notification rates in EU/EEA, 2011 • In the EU/EEA, 72 334 TB cases were reported in 2011. • Notification rate 14.2 per 100 000 population (range 2.8 – 89.7). Figure 1: Country-specific TB notification rates, 2011 < 10 per 100 000 10 to 19 per 100 000 20 to 49 per 100 000 50 to 99 per 100 000 Not included or not reporting
TB notification rates in EU/EEA, 2007−2011 • Overall in the EU/EEA, notification rates have steadily declined. Figure 2: Trend in TB notification rate in the EU/EEA 2007−2011
Proportion of confirmed* TB cases in the EU/EEA, 2011 • Overall 61.3% (range 27.9 – 94.8%) of TB cases reported • in the EU/EEA were laboratory-confirmed. • Figure 3: Country-specific proportion of all confirmed TB cases in 2011. < 60% 60 to 69% 70 to 79% ≥ 80% Not included or not reporting *Confirmed by culture or both a positive sputum microscopy result and Mycobacterium tuberculosisnucleic acid identified in nucleic acid amplification test.
TB notification rates in children<15 years of age in EU/EEA, 2011 • In 2011, 3 190 cases of TB in children were reported, accounting for 4.4% of all notified TB cases (range 0 – 11.1%) in the EU/EEA. Figure 4: Country-specific childhood TB notification rates among child population (0–14 years), 2011 < 2 per 100 000 child population 2 to 3.9 per 100 000 child population 4 to 9.9 per 100 000 child population ≥ 10 per 100 000 child population Not included or not reporting
Proportion of foreign origin among notified TB cases in EU/EEA, 2011 • Figure 5: Country-specific proportion of foreign origin cases among all notified TB cases, EU/EEA, 2011 < 1% 1 to 24% 25 to 49% 50 to 74% ≥ 75% Not included or not reporting In 2011, the overall proportion of TB cases of foreign origin in the EU/EEA was 25.8% (range 0.3 – 89.4%).
Proportion of notified extrapulmonary TB cases in EU/EEA, 2011 • Figure 6: Country-specific proportion of extrapulmonary TB of all notified TB cases, EU/EEA, 2011 < 5% 5 to 19% 20 to 29% 30 to 49% ≥ 50% Not included or not reporting In 2011, the overall proportion of extrapulmonary TB cases in the EU/EEA was 22.3% (range 3.9 – 66.7%).
ExtrapulmonaryTB notification rates in EU/EEA, 2002−2011 • Extrapulmonary TB notification rates have remainedstable in the last 10 years. Figure 7: Trend in extrapulmonary TB notification rate in the EU/EEA, 2002−2011
Proportions of TB by site among all notified TB cases in EU/EEA, 2002−2011 • Percentage of extrapulmonary TB increased from 16.4% in 2002 to 22.4% in 2011. Figure 8: Proportion of notified pulmonary and extrapulmonary TB cases in the EU/EEA, 2002−2011
Proportion of culture-confirmed new pulmonary TB cases in EU/EEA, 2011 • 69% of new pulmonary TB cases were culture-confirmed. • The proportion varied widely across countries (range 0 – 98%). Figure 9: Proportion of new pulmonary TB cases confirmed by culture, 2011
Proportion of notified TB cases with multi-drug resistance among all confirmed TB cases in EU/EEA, 2011 • Figure 10: Country-specific proportion of multidrug resistance among all confirmed TB cases, • EU/EEA, 2011 < 1% 1 to 1.9% 2 to 4.9% 5 to 9.9% ≥ 10% Not included or not reporting In 2011, the overall proportion of TB cases with multi-drug resistance in the EU/EEA was 4.5% (range 0 – 29.8%).
Proportion of notified new TB cases with multidrug resistance in EU/EEA, 2011 • Figure 11: Country-specific proportion of new TB cases with multidrug resistance, EU/EEA, 2011 < 1% 1 to 1.9% 2 to 4.9% 5 to 9.9% ≥ 10% Not included or not reporting In 2011, the overall proportion of new TB cases with multi-drug resistance in the EU/EEA was 2.4% (range 0 – 23.3%).
Notification rates of new cases with multidrug resistant TB in EU/EEA, 2007−2011 • The notification rate of multidrug resistant TB have remained stable at around 0.3 per 100 000 population. Figure 12: Trends in multidrug resistant TB notification rate in the EU/EEA, 2007−2011
Proportion of notified previously treated TB cases with multidrug resistance in EU/EEA, 2011 • Figure 13: Country-specific proportion of previously treated TB cases with multi-drug resistance, EU/EEA, 2011 < 1% 1 to 1.9% 2 to 4.9% 5 to 9.9% ≥ 10% Not included or not reporting In 2011, the overall proportion of previously treated TB cases with multidrug resistance in the EU/EEA was 16.8% (range 0 – 57.7%).
Proportion of TB cases with extensive drug resistance among MDR-TB cases with SLD ST* reported in EU/EEA, 2011 • Figure 14: Country-specific proportion of extensively drug resistant TB cases among TB cases with multi-drug • resistance, EU/EEA, 2011 < 1% 1 to 4% 5 to 9% 10 to 19% ≥ 20% Not included or not reporting Not included or not reporting *SLD ST – second line drug susceptibility testing result In 2011, the proportion of extensive drug resistant cases among cases with multidrug resistance in EU/EEA was 13.4% (range 0 – 40.0%).
Proportion of HIV positive TB cases among all TB cases with known HIV status in EU/EEA, 2011 • Figure 15: Country-specific proportion of HIV positive TB cases among TB cases with known HIV status, EU/EEA, 2011 < 1% 1 to 1.9% 2 to 4.9% 5 to 9.9% ≥ 10% Not included or not reporting In 2011, the overall proportion of HIV positive TB cases among TB cases with known HIV status in EU/EEA was 4.7% (range 0 – 40%).
Treatment success rate for new pulmonary TB cases in EU/EEA*, 2010 • The treatment success rate for new culture-confirmed pulmonary TB cases notified in 2010 was 76.8% (range: 0 – 91.4%). Figure 16: Treatment success rate for new culture-confirmed pulmonary TB cases notified in 2010 * Five EU/EEA Member States did not report treatment outcome data.
Treatment success rate for new pulmonary TB cases by year of reportingin EU/EEA, 2006−2010 • The treatment success rate for new culture-confirmed pulmonary TB cases notified between 2006 and 2010 has slightly decreased from 79.5% in 2006 to 76.8% in 2010. Figure 17: Treatment success rate for new culture-confirmed pulmonary TB cases notified in 2006−2010
Treatment success rate for previously treated pulmonary TB cases in EU/EEA*, 2010 • The treatment success rate for previously treated culture-confirmed pulmonary TB cases notified in 2010 was 53.7% (range 31.4 – 85.7%). Figure 18: Treatment success rate for previously treated culture-confirmed pulmonary TB cases notified in 2010 * Iceland and Luxembourg reported zero previously treated TB cases in 2010. Seven EU/EEA Member States did not report stratified treatment outcome data
Treatment success rate for all notified pulmonary TB cases in EU/EEA*, 2010 • The treatment success rate for all confirmed pulmonary TB cases notified in 2010 was 72.4% (range 0 – 88.9%). Figure 19: Treatment success rate for all confirmed pulmonary TB cases notified in 2010 * Five EU/EEA Member States did not report treatment outcome data
Treatment success* rate for extrapulmonary TB cases in EU/EEA**, 2010 • The treatment success rate for extrapulmonary TB cases notified in 2010 was 82.2% (range 21.1 – 100%). Figure 20: Treatment success rate for extrapulmonary TB cases notified in 2010 *Treatment success of extrapulmonary TB consists of cases reported as completed full course of anti-tuberculosis treatment ** Seven Member States did not report stratified treatment outcome data
Treatment success rate for notified multidrug-resistant TB cases in EU/EEA*, 2009 • The treatment success rate for all confirmed multidrug-resistant TB cases notified in 2009 was 31.6% (range 0 – 84.6%). Figure 21: Treatment success rate for all confirmed multidrug-resistant TB cases notified in 2009 * Malta reported zero MDR TB cases in 2009, 11 Member States did not report treatment outcome data
Treatment outcome for multidrug-resistant TB cases notified in 2007−2009 • Treatment outcomes for multidrug-resistant TB cases did not improve between the 2007 and 2009 cohort, EU/EEA. Figure 22: Treatment outcome at 24 months for multidrug-resistant TB cases diagnosed in 2009, compared with cases diagnosed in 2007 and 2008