Interactive Thermodynamic Data Lookup Tool
Develop a program to extract thermodynamic data from a temperature table file. Interpolate data for in-between temperatures. Ensure error checking and proper data handling.

Interactive Thermodynamic Data Lookup Tool
E N D
Presentation Transcript
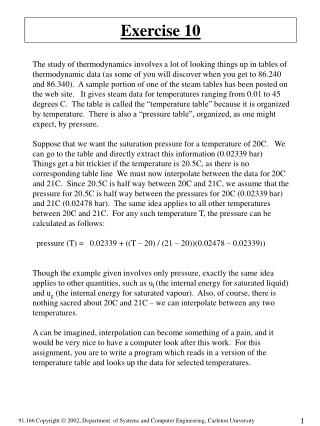
Exercise 10 The study of thermodynamics involves a lot of looking things up in tables of thermodynamic data (as some of you will discover when you get to 86.240 and 86.340). A sample portion of one of the steam tables has been posted on the web site. It gives steam data for temperatures ranging from 0.01 to 45 degrees C. The table is called the “temperature table” because it is organized by temperature. There is also a “pressure table”, organized, as one might expect, by pressure. Suppose that we want the saturation pressure for a temperature of 20C. We can go to the table and directly extract this information (0.02339 bar) Things get a bit trickier if the temperature is 20.5C, as there is no corresponding table line We must now interpolate between the data for 20C and 21C. Since 20.5C is half way between 20C and 21C, we assume that the pressure for 20.5C is half way between the pressures for 20C (0.02339 bar) and 21C (0.02478 bar). The same idea applies to all other temperatures between 20C and 21C. For any such temperature T, the pressure can be calculated as follows: pressure (T) = 0.02339 + ((T – 20) / (21 – 20))(0.02478 – 0.02339)) Though the example given involves only pressure, exactly the same idea applies to other quantities, such as uf (the internal energy for saturated liquid) and ug (the internal energy for saturated vapour). Also, of course, there is nothing sacred about 20C and 21C – we can interpolate between any two temperatures. A can be imagined, interpolation can become something of a pain, and it would be very nice to have a computer look after this work. For this assignment, you are to write a program which reads in a version of the temperature table and looks up the data for selected temperatures.
File “table.dat” (supplied) contains an abbreviated temperature table. There are only four columns. The first is temperature (in degrees C), the second is pressure (in bar), the third is uf (in KJ/kg), and the fourth is ug (also in KJ/kg). The temperature values are somewhat irregularly spaced, but, for our purposes, this doesn’t matter. The only thing that really matters is that the temperatures are in ascending order. You can count on this, and need not do any checking. Your program should behave exactly as the sample executable does. To get you started, some functions have been supplied (see skeleton.cpp). You MAY NOT modify the main function supplied but must instead use it exactly as it is (except in that, if your compiler doesn’t need it, you can get rid of the call to “pause”). I want to force you to use functions, and in particular I want to ensure that you get some experience with array parameters. Use of the other two functions is optional. Function “read_in_table” should check for invalid (non-numeric) data , and should ensure that the table contains at least two lines of data,. It should also stop reading if the table is too long for the arrays supplied If any form of error is detected, the function should output an explanatory message and return false. You can “look up” a temperature in the table any way you want, as long as it works. Your recent experience (assignment 9) should, however, strongly suggest the best way of doing this.