
Uploaded by
zeno
1 SLIDES
114 VUES
10LIKES
Differential Gene Expression COG Clusters Analysis |
DESCRIPTION
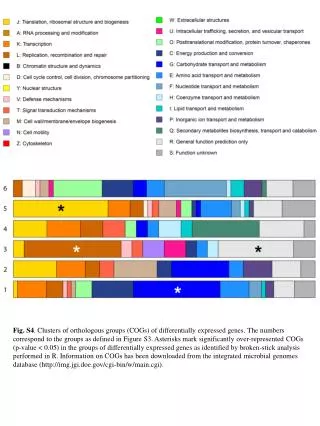
Identification of COG clusters of differentially expressed genes for microbial genomes. Analysis performed in R using broken-stick method. Significantly over-represented COGs marked with asterisks. COG information retrieved from IMG: Integrated Microbial Genomes Database.
Download
1 / 1
Télécharger la présentation 
Differential Gene Expression COG Clusters Analysis |
An Image/Link below is provided (as is) to download presentation
Download Policy: Content on the Website is provided to you AS IS for your information and personal use and may not be sold / licensed / shared on other websites without getting consent from its author.
Content is provided to you AS IS for your information and personal use only.
Download presentation by click this link.
While downloading, if for some reason you are not able to download a presentation, the publisher may have deleted the file from their server.
During download, if you can't get a presentation, the file might be deleted by the publisher.
E N D
Presentation Transcript
Fig. S4. Clusters of orthologous groups (COGs) of differentially expressed genes. The numbers correspond to the groups as defined in Figure S3. Asterisks mark significantly over-represented COGs (p-value < 0.05) in the groups of differentially expressed genes as identified by broken-stick analysis performed in R. Information on COGs has been downloaded from the integrated microbial genomes database (http://img.jgi.doe.gov/cgi-bin/w/main.cgi).
More Related