Equations and Graphs
Equations and Graphs. I will be able to use a T- table to graph equations. Homework Weekly assignment Pg #---. Warm Up. The ancient Greeks and Romans thought golden rectangles were pleasing to the eye. In a golden rectangle, the ratio of the length to the width is close to 1.62 : 1

Equations and Graphs
E N D
Presentation Transcript
Equations and Graphs I will be able to use a T- table to graph equations • Homework • Weekly assignment • Pg #---
Warm Up • The ancient Greeks and Romans thought golden rectangles were pleasing to the eye. In a golden rectangle, the ratio of the length to the width is close to 1.62 : 1 • For the rectangle below, use the equation to find the length and then determine whether it is in golden ratio. P= 110 in. 2x + 42 = 110 x 21 in
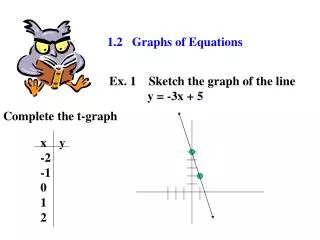
Make a T- table and graph each equation • Y = 2x- 2 • y = 5- x • Y = 1/5 x -3
What can you tell from the graph of an equation ? • Kara went to the county fair. Admission was $ 3. It also costs $0.75 for each ride ticket. The equation y = 3 + 0.75 x gives the total money Kara spent for the admission and x tickets.
If Kara spent $ 7.50 in all how many ride tickets did she buy?
Uses of Line graphs • A line graph is often used to represent a set of data values in which a quantity varies with time. These graphs are useful for finding trends. That is, finding a general pattern in data sets including temperature, sales, employment, company profit or cost over a period of time
Closure • Equations • Coordinate Grid • Line Graph