Download
1 / 8
80 likes | 170 Vues
Study strategic marketing approaches for business success with a focus on low-cost strategies, cost classifications, and volume examples. Learn how to apply cost concepts effectively to drive profitability and market growth.

E N D
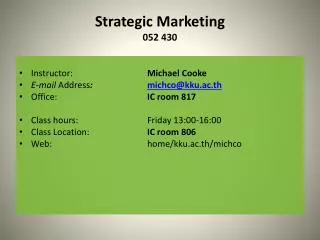
Strategic Marketing052 430 • Instructor: Michael Cooke • E-mail Address:michco@kku.ac.th • Office: IC room 817 • Class hours: Friday 13:00-16:00 • Class Location: IC room 806 • Web: home/kku.ac.th/michco
Term Project • Likely Project Topics • Thai silk • Thai tourist industry • Thai rice • Thai shrimp • Other business or industry • Choose a topic and a partner by 7-December • Advise 10-15 minute presentation, papers accepted • Can use theFive Forces framework to look at the business • Suggest and support a market strategy for the industry or a firm within the industry • Due 1 February
Notes for “Art of Pricewar” • The context: three generic strategies for a company: • Find a niche • Differentiate (innovate) • Low cost – the focus for today • Low cost requires high volume in most cases • High volume can be achieved by organic growth or through mergers and acquisitions • Organic growth achieved by gaining market share or by sharing in a growing market • Horizontal integration: expansion of activities at the same level • Production economies of scale • Shared resources when the firm is in several similar businesses (IT, finance, etc) • Potential global reach (and reduced trade costs with production bases abroad) • Size brings more power over suppliers • Disadvantage may be difficult to manage due to bureaucratic structure or complexity • Vertical integration: expansion into activities above or below. • Supply chain coordination and control advantages • Cost advantages (from owning profits and from escaping transaction taxes) • Cost disadvantages • Lack of competition – Note: onereason firms outsource • Scale of upstream or downstream activities might be small • Lack of flexibility from owning upstream and downstream assets • Potentially puts the firm in position of competing with customers
Fixed and Variable Costs • Cost classification depends on how costs change with business activity • Fixed costs do not change with volume • Example: Management salaries, property • Fixed costs are typically allocated (full costing) • Variable costs vary in proportion to volume • Examples: Direct materials, direct labor, variable factory overhead • Also called direct costs • Step Variable or Step Fixed costs are constant over some range, then increase • Marginal cost is the cost of an additional unit • Marginal cost of carrying one additional airline passenger is near zero if seats are available • Marginal cost of one additional passenger would be high if a flight has to be added • All external reporting uses absorption or full cost • Includes fixed factory overhead • Margins are lower than with variable costing • Internal decision makers may use variable costing
Volume Example 1– BreakevenReduce Price, Increase Volume • Rev $12,000,000 • COGS $6,000,000 • Gross p $6,000,000 • R&D 1,000,000 • SG&A 5,000,000 • Expense $6,000,000 • Net p $0 • Units 1,000,000 • Price/unit $12 • Cost per unit$6 • Rev $18,000,000 • COGS $12,000,000 • Gross p $6,000,000 • R&D 1,000,000 • SG&A 5,000,000 • Expense $6,000,000 • Net p $0 • Units 2,000,000 • Price/unit $9 • Cost per unit$6
Volume Example 2 – Production Run • Volume 100,000 • Setup $ 50,000 • Direct A* $200,000 • Total $250,000 • Cost/unit $2.50 • * Ave direct cost per unit is $2. • Volume 800,000 • Setup $ 50,000 • Direct* $ 400,000 • Total $450,000 • Cost/unit $0.56 • * Ave direct cost per unit is $0.50 (A+700,000*$0.29) /800,000
Volume Example 3–Lower Cost • Rev $12,000,000 • COGS $6,000,000 • Gross p $6,000,000 • R&D 1,000,000 • SG&A 5,000,000 • Expense $6,000,000 • Net $ 0 • Units 1,000,000 • Price/unit $12 • Unit cost $ 6 • Rev $18,000,000 • COGS $10,000,000 • Gross p $8,000,000 • R&D 1,000,000 • SG&A 5,000,000 • Expense $6,000,000 • Net $2,000,000 • Units 2,000,000 • Price/unit $9 • Unit cost $5
Applying Basic Cost Concepts • Assume excess capacity • What is the lowest price a company would accept? • If COGS includes $1 fixed factory cost/unit? • Suppose a company prices additional units at direct cost • Would this affect the price of current units? • Where does overhead go when products are priced at variable cost? • How would a customer react to a price increase later? • Assume longer production run (example 2) • Would a company accept losses on initial orders to build a market? • High cost of initial production would deter prospective customers if passed through in prices • Expected volumes may be used when products are early in their life cycle • Galanz’s pricing strategy – costs decrease when sales increase • IBEA merely quantifies the effects of price*volume and unit cost*volume where prices, volumes and costs are changing • http://home.kku.ac.th/michco/Business_Strategy/Gross margin calcs.xlsx