Sustainable Waste Management: Geographical Processes and Social Implications
This study explores waste management focusing on geographical processes, stakeholder perceptions, social dimensions, economic implications, and sustainable practices. It delves into the environmental effects of waste, economic growth's impact on waste generation, and social consequences for communities near disposal sites. The analysis includes an exploration of waste statistics in Australia, the perspective from a leading waste management company, and official reports on recycling trends and household practices over the years.


Sustainable Waste Management: Geographical Processes and Social Implications
E N D
Presentation Transcript
Waste Management By Ms Giveen Stage 5 Geography 2013
Syllabus Agenda The geographical processes relevant to Waste Management • Management of the issue and implications for sustainability, social justice and equity 1 2 3 4 5 The perceptions of different groups about waste management Individual, group and government responses to Waste Management • Decision-making processes involved in the management of Waste Management
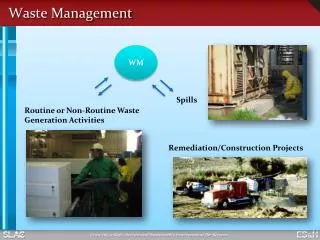
Geographical Processes What is waste management? Why is it an issue? Who are the stakeholders affected? When does it need to be dealt with Where is waste generated from?
What is Waste Management? Environment Effects • Waste is an issue that relates to all areas of the environment. • There is potential for inappropriately disposed waste to contaminate land and groundwater with heavy metals and other toxins • There may be lacking some government oversight of waste management. • The release of methane and other gases from decomposing waste is also an issue as this contributes to greenhouse gas emissions and poor air quality. • Non-biodegradable plastics are also a concern as these persist in the environment for many years and can wash into oceans and estuaries, harming marine and bird life
What is Waste Management? Economic Dimensions International evidence suggests that economic growth contributes to growth in the amount of waste generated per person (Productivity Commission 2006) As the total volume of waste generated in Australia increases, so does the importance of businesses that exist to extract and recover materials from waste
What is Waste Management? Social Dimensions Waste has social implications, especially for those who reside near waste disposal sites. Poorer health outcomes may be a concern for residents living near waste disposal sites. Also, proximity to disposal sites may reduce property prices and income sources, which is also an issue affecting people's wellbeing.
One Companies Perspective SITA Australia Analysis (A sustainable resource recovery management company) • Australians generate about 600 kilograms of waste per year per person, making us one of the highest generators of household waste. • In Australia, about 350 million batteries are purchased every year. Over two thirds of batteries being disposed of are sent to landfill making them the most common form of hazardous waste. • Organic waste includes any animal or plant based material and degradable carbon such as garden organics, food, timber, paper and cardboard. When sent to landfill the organic material undergoes anaerobic decomposition, generating a potent greenhouse gas, methane. • Electronic waste can contain toxic materials such as lead, mercury, cadmium, hexavalent chromium and brominated fire retardants that are hazardous, difficult to dispose of and potentially damaging to the environment. • Australians dispose of approximately 50 to 60 million fluorescent tubes and HID (high in density discharge) lamps every year, resulting in large amounts of mercury being sent to our landfills.
More SITA Statistics • Glass was discovered by the Phoenicians more than 5,000 years ago, which makes it one of the worlds oldest forms of packaging • In 2010, Australians recycled only 30.3% of their steel cans and 67.4% of aluminium cans. Many steel cans are still being sent to landfill, despite 93% of Australians having access to kerbside recycling services that accept steel packaging. • In Australia, 376,000 tonnes of plastic packaging is used every year. In 2010 SITA recycled 288,194 tonnes. • Australian households and businesses use millions of tonnes of paper every year. Over 5.5 million tonnes of paper and cardboard was used from 2006-2007, with 2.5 million tonnes of this recycled
The Official Reports On What We Are Doing The ABS says…. • The recycling activities of households grew extensively between 1996 and 2009. • In 1996, 91% of Australian households said they practised some form of waste recycling and/or reuse activity. • In 2009, almost all Australian households (98%) reported that they recycled waste and 86% reported that they reused waste. • In 2009, over 91% of Australian households used municipal kerbside recycling to recycle waste, an increase from 87% in 2006. • While these statistics tell us the number of households that have recycled at least one item during the previous 12 months, they do not indicate how much household waste is recycled.
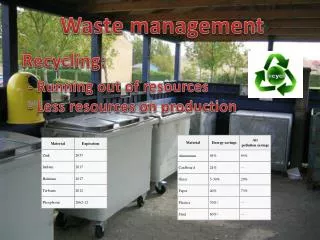
What Do We Recycle? Items commonly reused or recycled by households included: • paper, cardboard or newspapers (95%), • plastic bottles (94%), • glass (93%) and • plastic bags (90%).
How Much Waste Do You Produce? Between 1996-97 and 2006-07, the volume of waste produced per person in Australia grew at an average annual rate of 5.4%. In 1996-97, Australians generated approximately 1,200kg of waste per person. By 2006-07, this had increased to 2,100kg per person.