Download
1 / 29
320 likes | 584 Vues
Land surface memory & hydrological cycle over the U.S. west coast states & monsoon region Yun Fan and Huug van del Dool CPC/NCEP/NOAA. http://www.cpc.ncep.noaa.gov/soilmst/index.htm. Outline. Motivation Noah Land Surface Model & Data Results Land surface hydrological cycle

E N D
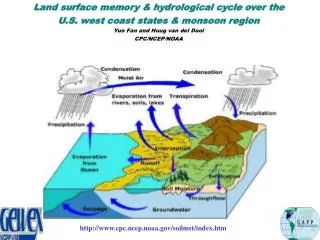
Land surface memory & hydrological cycle over the U.S. west coast states & monsoon region Yun Fan and Huug van del Dool CPC/NCEP/NOAA http://www.cpc.ncep.noaa.gov/soilmst/index.htm
Outline • Motivation • Noah Land Surface Model & Data • Results • Land surface hydrological cycle • Land memory studies • Summary
Motivation • Improve soil moisture data for CPC’s drought & flood monitoring tools • Improve weather & climate prediction with more accurate land initial conditions • Improve land surface model via data validation& model intercomparisons • Provide a long time series of realistic land surface data for land surface hydrological cycle, land memory & predictablity studies • Coupled atmosphere-land-ocean modeling • Develop new tools to use land surface data for climate monitoring & prediction • …
Motivation & Background CPC Leaky Bucket Model (Huang et al 1996) Where W(t) is soil water content, P(t) precipitation, E(t) evaportranspiration, R(t) net streamflow divergence, G(t) net groundwater loss. The ‘balance’ of the above equation is defined as the ‘budget’ (should equal dw/dt). Forcing Data: -CPC daily temperature updates -CPC daily precipitation updates (Higgins & Shi) -Monthly precipitation and temperature from NCDC Data Coverage: -73 years (1931-yesterday) on 344 US climate divisions • Current CPC soil moisture monitor & climate prediction activities: • Drought & flood monitoring • Empirical forecast tools (Constructed Analog) • GFS forecast & climate prediction
Motivation & Background (cont’) http://www.cpc.ncep.noaa.gov/soilmst/index.htm
Noah Land Surface Model Noah LSM Characteristics • Flexible soil layers: • user specified number and thickness (2-N). • Default is four soil layers (10, 30, 60, 100 cm thick) • Soil hydraulics and parameters follow Cosby et al. • Canopy resistance follows Jarvis et al. • Satellite-based annual cycle of vegetation greenness globally: • 5-year monthly climatology (NESDIS AVHRR • NDVI-based) • Flexible vegetation and soil classes and their parameters • easily modified via namelist I/O. Default: 12 SiB veg classes and 9 • Zobler soil classes (i.e. ISLCP-I) • Freeze/thaw soil physics follows Koren et al. • Snowpack density and water-equivalent content modeled • Patchy/fractional snow cover treated as function of snowdepth & veg type • Plug-compatible “drop-in” coding structure • link via one subroutine call and one argument list & no common blocks
Land Surface Water Budget & Soil Moisture Evolution P(t) - E(t) - R(t) – G(t)
Land Surface Water Budget Over Coterminous USA P(t) - E(t) - R(t) – G(t)
Table.1 US monthly values of all components of land surface hydrology (mm/mon) Mon W P E R+G P-E-R-G 1 581.2 (294.2) 52.0 5.5 31.8 14.6 2 592.5 (304.0) 49.8 10.3 33.3 6.2 3 600.0 (308.8) 62.9 24.5 39.1 -0.7 4 595.6 (302.0) 59.4 42.8 30.2 -13.7 5 582.8 (289.8) 70.9 64.8 21.2 -15.1 6 564.6 (276.8) 66.2 75.7 14.2 -23.8 7 538.4 (260.1) 64.8 77.8 10.4 -23.5 8 520.1 (250.0) 62.2 67.6 9.0 -14.3 9 514.3 (248.3) 61.4 49.3 8.8 3.3 10 520.2 (253.3) 51.7 31.9 9.1 10.8 11 539.8 (266.8) 58.0 14.0 13.5 30.5 12 565.8 (282.6) 58.5 4.5 27.3 26.8 Year 559.0 (278.1) 59.8 39.1 20.7 0.0 averaged over 125W-75W, 30N-48N
Land Surface Water Budget Over western coast states P(t) - E(t) - R(t) – G(t)
Table.2 US west coast states monthly values of all components of land surface hydrology (mm/mon) Mon W P E R+G P-E-R-G 1 595.1 (305.7) 99.0 -1.4 60.1 39.7 2 622.4 (324.4) 79.6 1.3 63.7 15.2 3 636.2 (330.5) 74.5 15.9 70.3 -10.4 4 624.9 (317.4) 47.1 33.3 44.7 -31.6 5 595.2 (293.5) 36.1 53.4 21.5 -39.6 6 554.7 (266.0) 26.3 63.1 8.5 -45.6 7 504.6 (233.1) 13.5 61.9 2.5 -51.0 8 463.4 (207.4) 18.6 43.8 1.3 -26.5 9 450.0 (201.4) 26.3 26.6 1.4 -1.5 10 460.2 (211.8) 44.7 14.6 3.9 25.7 11 507.0 (247.2) 93.3 3.7 19.4 72.3 12 563.8 (284.5) 97.2 -3.0 46.6 53.5 Year 548.1 (268.6) 54.7 26.1 28.7 -0.1 averaged over 125W-115W, 32N-49N
Land Surface Water Budget Over US Monsoon Region P(t) - E(t) - R(t) – G(t)
Table.3 US monsoon region monthly values of all components of land surface hydrology (mm/mon) Mon W P E R+G P-E-R-G 1 407.6 (206.5) 19.7 11.1 1.1 7.6 2 414.3 (212.0) 18.6 13.9 1.6 3.2 3 415.1 (211.1) 20.8 21.7 2.1 -3.0 4 404.7 (199.7) 12.2 25.7 1.2 -14.6 5 389.6 (185.3) 15.3 29.6 0.8 -15.2 6 375.9 (172.8) 17.8 28.7 0.7 -11.5 7 372.9 (171.0) 49.3 40.8 1.6 6.9 8 380.8 (179.5) 55.447.4 2.0 6.0 9 383.3 (182.0) 38.3 35.1 1.4 1.910 384.6 (183.0) 24.7 22.5 0.8 1.311 388.3 (186.5) 19.5 12.8 0.7 6.012 397.7 (195.6) 24.2 9.4 0.9 13.9 Year 392.9 (190.4) 26.3 24.9 1.2 0.2 averaged over 115W-103W, 31N-37N
Standard Deviation of Land Surface Water Budget components & Soil Moisture from 1960-1998
Soil moisture correlation: the west coast states vs all US areas
Soil moisture correlation: the US monsoon region vs all US areas
Evaporation correlation: the US monsoon region vs all US areas
Soil moisture & lag precip & surface temperature correlation: the west coast states vs all US areas
Soil moisture & lag precip & surface temperature correlation: the US monsoon region vs all US areas
Summary • In general, on a continental scale, the maximum of soil moisture (W) is in winter and the minimum is in summer, with some regional exceptions. • For the precipitation (P), the west coast states have a strong seasonal cycle, with maximum in winter and minimum in summer. In US monsoon region P & Florida it peaks in summer, while in some area precipitation does not vary too much over the course of the annual cycle. • Evaporation (E) shows a pronounced seasonal cycle: maximum in warm season and minimum in cold season, while the runoff (surface runoff+subsurface runoff) (R) is opposite, with maximum in cold season and minimum in warm season (exception: mountain areas wait till spring melt). • Land surface hydrological cycle: most part of the states - land surface water is recharged during the cold season and discharged during the warm season, with some exceptions: the northern part states, snow melt plays an important role for land surface water recharge in the spring. In the US monsoon area discharged in the spring & recharges in the summer. • Evolution of land surface memory: depends on time & space. • Impact of land surface memory: • The west coast states has more large scale structure • US monsoon region seems more localized