Your Resources and Sustainability assignment
180 likes | 356 Vues
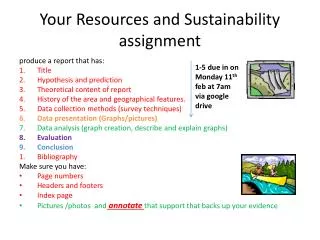
Your Resources and Sustainability assignment. produce a report that has: Title Hypothesis and prediction Theoretical content of report History of the area and geographical features. Data collection methods (survey techniques) Data presentation ( Graphs/pictures)

Your Resources and Sustainability assignment
E N D
Presentation Transcript
Your Resources and Sustainability assignment produce a report that has: • Title • Hypothesis and prediction • Theoretical content of report • History of the area and geographical features. • Data collection methods (survey techniques) • Data presentation (Graphs/pictures) • Data analysis (graph creation, describe and explain graphs) • Evaluation • Conclusion • Bibliography Make sure you have: • Page numbers • Headers and footers • Index page • Pictures /photos and annotate that support that backs up your evidence 1-5 due in on Monday 11thfeb at 7am via google drive
To be done before we go out on the trip • Title • Hypothesis • Content of report (what are you going to do?) • History of the area and geographical features and processes. • Data collection methods (survey techniques) • Question for Dave on the history, resource type, species diversity and human influence and usage.
Equipment list • Infilometer • Measuring jug • Measuring tape • Species identification books • Colorimeter: Water PH and O2 quality • Quardat • Clinometer • Tray, Net, Trent biotic index sheet • Soil PH kit? • ruler
Hand in date: • The start of the day on Monday 25th of February and submitted via google drive (7.30am) with your full name (on your section of the report) on to the relevant teacher on a word/google document. • This is an individual assessment report.
Hypothesis and the areas of research Hypothesis: To what extent can the Novaliches reserve be seen as a valuable resource?
Research areas throughout the report that you will cover: • Ecosystem types (Species diversity, identification & quality to evident two resources). • Infiltration rates. • What evidence to support that humans use the Novaliches watershed? but include the three influences to your report as factors of influence.
To what extent can the Novaliches reserve be seen as a valuable resource? The Novaliches watershed offers many resources such as…….. Throughout the report I hope to evident the………… as resource and the……as a resource for……….
(A) The Vegetation Site Vegetation diversity, coverage & height inVegetated area Measure vegetation diversity by throwing the quadrant to your feet randomly, and counting the Number of different plant specie in the quadrat – in a sparse area to represent where there are human encroachments and a dense area to represent where there have not been human encroachments Vegetation coverage/density will be recoded by eyeballing and estimating the % coverage on a sparsely and a densely vegetated area. To measure the height of vegetation measure the highest piece of vegetation from the center square of the quadrat and record its height in cm using a small ruler • Diversity • Trial 1….. • Trail 2….. • Trial 3….. • Trial 4….. • Trial 5….. • Average no of species…….. • Coverage • Trial 1….. • Trail 2….. • Trial 3….. • Trial 4….. • Trial 5….. • Average % cover…….. • Height • Trial 1….. • Trail 2….. • Trial 3….. • Trial 4….. • Trial 5….. • Average Height (cm)……..
(A) The Vegetation Site Vegetation diversity, coverage & height inSparse area Measure vegetation diversity by throwing the quadrant to your feet randomly, and counting the Number of different plant specie in the quadrat – in a sparse area to represent where there are human encroachments and a dense area to represent where there have not been human encroachments Vegetation coverage/density will be recoded by eyeballing and estimating the % coverage on a sparsely and a densely vegetated area. To measure the height of vegetation measure the highest piece of vegetation from the center square of the quadrat and record its height in cm using a small ruler • Diversity • Trial 1….. • Trail 2….. • Trial 3….. • Trial 4….. • Trial 5….. • Average no of species…….. • Coverage • Trial 1….. • Trail 2….. • Trial 3….. • Trial 4….. • Trial 5….. • Average % cover…….. • Height • Trial 1….. • Trail 2….. • Trial 3….. • Trial 4….. • Trial 5….. • Average Height (cm)……..
(A) The Vegetation Site Infiltration rates: Vegetated area Put 5 centimeters of water in the infiltrometer and time how long it takes to infiltrate into the soil on a dense and sparsely vegetated area. The dense area represents an area without human encroachments & the sparse area represents and are where they have been human encroachments. Level of water Time taken In Inflitrometer to infiltrate 5 cm 4 cm ……….. 3 cm ………… 2 cm ………… 1 cm ………….. 0 cm ………….. Total time taken: ________ (minutes) To find out the average infiltration rate of your soil divide the total time taken, by 5 this will give you the average rate in cm per second Average infiltration rate in vegetated area: ________ (cm/min)
(A) The Vegetation Site Infiltration rates: Sparse area Put 5 centimeters of water in the infiltrometer and time how long it takes to infiltrate into the soil on a dense and sparsely vegetated area. The dense area represents an area without human encroachments & the sparse area represents and are where they have been human encroachments. Level of water Time taken In Inflitrometer to infiltrate (mins) 5 cm 4 cm ……….. 3 cm ………… 2 cm ………… 1 cm ………….. 0 cm ………….. Total time taken: ________ (minutes) To find out the average infiltration rate of your soil divide the total time taken by 5, this will give you the average rate in cm per minute Average infiltration rate in sparse area: ________ (cm/min)
(B) The Biodiversity Site Biodiversity of the area. • Diversity (number • of different flora species and • Species type,picture evidence • needed) • Quadrat 1….. • Quadrat 2….. • Quadrat 3….. • Quadrat 4….. • Quadrat 5….. • Average no of species per Quadrat…….. • Total no of species…….. Use the litmus paper to get this data: 1) Soil pH ………………. • Abundance (of living organisms) • Quadrat 1 • Quadrat 2 • Quadrat 3 • Quadrat 4 • Quadrat 5 • Average no of living organisms per trial …… • Total no of living organisms….. Abundance & diversity is measured by placing the quadrat on a chosen area and disturbing the soil/twigs and dean logs to assess the species. Names & numbers of organisms
(C) Environmental questionnaire POTENTIAL HUMAN INTERACTION AT THE ECOSYSTEM. Q1: Q2: Q3: Q4: Q5: Q6: Q7: Q8: Q9: Q10: 5-10 questions trying to prove human interaction on the ecosystem in either a positive, negative or both. There should be: OPEN, CLOSED AND PROBING questions. REMEMBER TO ASK POLITLY IF IT WOULD BE OK TO ASK SOME QUESTIONS AND EXPLAIN THE REASONS YOU ARE THERE.
(C) The River Processes Site Measuring the wetted perimeter, cross sectional area & hydraulic radius Width……………… • Put in the other verticals (50 cm away from each other – the first two are marked), and record the depth midway between each one • Number of verticals …….. • Average depth………. • Cross sectional area (average depth x width) ………cm • Hydraulic radius =………………… Depth of vertical B)……… Depth of vertical A)………
(C) The River Processes Site Wetted perimeter & velocity • Wetted perimeter of stream _______ meters • Velocity of the stream = • Trail 1 = ____seconds • Trail 2 =____seconds • Trial 3 = ____seconds • Trial 4 = ____seconds • Trial 5 = ____seconds • Average _____ seconds to travel 5 meters • The stream velocity in meters a second ______ velocity= distance time
(D) The Flooding Assessment Site The Hjulstrom Curve……. Assessing the potential of the river to flood 1) Long Axis of largest sediment: ………………. Velocity needed to move largest sediment:……………. (based on Hjulstrom curve) 2) Width of River in flood……………… Average Height of river in flood…………… Cross sectional Area of river in flood………….. (av. Width x Height) Estimated Wetted Perimeter in flood…………… (depth x 2 + width) 3) Estimated Discharge of river in flood………….. (Cross sectional Area x Velocity) Estimated Hydraulic Radius of the river in flood………. * Remember to take 5 photos of evidence of flooding