3-26-13 Describing Data
170 likes | 400 Vues
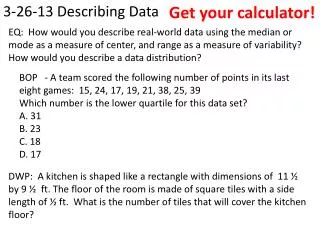
3-26-13 Describing Data . Get your calculator!. EQ: How would you describe real-world data using the median or mode as a measure of center, and range as a measure of variability? How would you describe a data distribution? .

3-26-13 Describing Data
E N D
Presentation Transcript
3-26-13 Describing Data Get your calculator! EQ: How would you describe real-world data using the median or mode as a measure of center, and range as a measure of variability? How would you describe a data distribution? BOP - A team scored the following number of points in its last eight games: 15, 24, 17, 19, 21, 38, 25, 39 Which number is the lower quartile for this data set?A. 31 B. 23 C. 18 D. 17 DWP: A kitchen is shaped like a rectangle with dimensions of 11 ½ by 9 ½ ft. The floor of the room is made of square tiles with a side length of ½ ft. What is the number of tiles that will cover the kitchen floor?
A team scored the following number of points in its last eight games: 15, 24, 17, 19, 21, 38, 25, 39 Which number is the lower quartile for this data set?A. 31 B. 23 C. 18 D. 17 Answer: C Former EOG Grade 7 Sample Items Goal 4, #2 DWP: A kitchen is shaped like a rectangle with dimensions of 11 ½ by 9 ½ ft. The floor of the room is made of square tiles with a side length of ½ ft. What is the number of tiles that will cover the kitchen floor? 437tiles
BOP - A notebook costs $4.50 plus sales tax. After sales tax, the notebook is $4.86. What is the sales tax rate? A . 6% B. 7% C. 8% D. 9% Check homework
Data is often collected to make predictions or determine what is happening within a given group. In order for data to accurately depict a population, The data must be collected from a RANDOM SAMPLE.
Below is the data collected from two random samples of 100 students regarding student’s school lunch preference. Make at least two inferences based on the results.
Classify each of the following as categorical or numerical (quantitative) data: Birth year Number of books read Favorite genre of books Shoe size Zip code Name others…
The two data sets below depict random samples of the management Salaries in two companies. Based on the salaries below which measure Of center will provide the most accurate estimation of the salaries for Each company?
Name some ways that data can be organized: Frequency tables, Stem and leaf plots Bar graphs Box plot Dot plot Histogram Circle graph Line graph Others?
Once data is organized it can be described by: CENTER - Mean or Median SPREAD- Range, Interquartile Range and Mean Absolute Deviation (M.A.D) SHAPE-Mound Shape, Skew Right, Skew Left, and Uniform
Skewed right - Extreme low values on the right Mounding or bell shaped
Skewed left - extreme low values On the left Uniform
Work on review handout. Finish for homework.
EXIT ACTIVITY: 3 - Name three things you have learned about data and statistics 2 - Name two things you are still unsure about. 1 - Name one thing you want to learn more about.