Download
1 / 29
290 likes | 470 Vues
PRESSURE-WIND RELATIONSHIPS – One curve does NOT fit all Examples of 130 kt Hurricanes: Charley (941 mb) and Katrina (913 mb). Tropical Cyclone Central Pressure (or Minimum Sea Level Pressure - MSLP). Analysis of TC Central Pressure – Required for TC Advisories

E N D
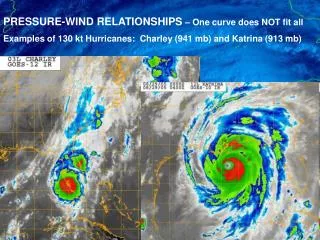
PRESSURE-WIND RELATIONSHIPS – One curve does NOT fit all Examples of 130 kt Hurricanes: Charley (941 mb) and Katrina (913 mb)
Tropical Cyclone Central Pressure (or Minimum Sea Level Pressure - MSLP) • Analysis of TC Central Pressure – • Required for TC Advisories • Required for “TC Vitals” (model input) • Required for running SLOSH • (No requirements for forecasting TC Central Pressure.)
GSI (Gridpoint Statistical Interpolation analysis) 2009 Changes for the GFS (Global Forecast System) • Implementing improved techniques in GSI analysis. • Adding new observation data sources. • Tropical storm pseudo sea-level pressure obs
Current Pressure-Wind Relationship Utilized (in absence of aircraft reconnaissance)
PRESSURE-WIND RELATIONSHIPS – Is there a better method than a single one-to-one correspondence?
Knaff and Zehr (Weather and Forecasting, 2007): • Developed a generalized pressure-wind relationship that takes into account environmental pressure, speed, size, and latitude • Utilize NHC’s best track winds from 1989-2004 interpolated to the times of aircraft center fixes – 3801 cases
Straight pressure-wind relationship of all 3801 cases 90% of variance explained
Slightly better P-W fit accounting for pressure gradient and translational speed 91% of variance explained
Effect of latitude on pressure-wind relationships… Stronger winds at lower latitude for same delta-P
Effect of size on pressure-wind relationships… Stronger winds in smaller TCs for same delta-P Size calculated by average tangential surface winds in a 400-600 km annulus
Knaff and Zehr Pressure-wind Relationship • 94% of Variance Explained • Variables Needed: • Vmax • Translational Speed • Average tangential surface winds in a 400-600 km annulus • Environmental Pressure • Latitude
Improved estimate of central pressure… (In 1989-2004 dependent sample)
Improvement shown in independent sample of 2005 hurricane season (524 cases)
Lessons Learned in Getting Knaff-Zehr P-W Relationship into Operations in Australia The method did not mesh with operations; required extra effort to calculate parameters S (TC size) and Penv (environmental pressure) There was an issue with very low latitude storms (that were not in the developmental dataset) Using the low-level winds to estimate V500 ( for S) did not account for land exposures, resulting in an erroneously estimate of S when land was within 500 km. Eye size / radius of maximum wind still matters - remains a problem.
Use average Radius of 34 kt winds instead of tangential winds in 400-600 km annulus…
Environmental Pressure Environmental pressure (Penv) is estimated from the Pressure of Outer Closed Isobar (POCI)
Revised pressure-wind relationship – Courtney and Knaff (2009) • Variables Needed: • Vmax • Translational Speed • Radius of 34 kt Winds • Pressure of Outer Closed Isobar • Latitude
Example of Sensitivity in Pressure-Wind Relationship: Assuming a 1014 mb environmental pressure: Small, low latitude, fast 35 kt TC = 1008 mb Large, high latitude, slow 35 kt TC = 999 mb
Second Example of Sensitivity in Pressure-Wind Relationship: Assuming a 1014 mb environmental pressure: Small, low latitude, fast 65 kt TC = 994 mb Large, high latitude, slow 65 kt TC = 984 mb
How would Knaff-Zehr Pressure-Wind Relationship perform for these two contrasting hurricanes?
How would Knaff-Zehr Pressure-Wind Relationship perform for these two contrasting hurricanes? • Variables Input: • Vmax = 130 kt • Speed = 10 kt • Radius of 34 kt = 175 nm • POCI = 1006 mb • Latitude = 28N • Dvorak = 932 mb • Knaff-Zehr = 923 mb • Actual = 913 mb
How would Knaff-Zehr Pressure-Wind Relationship perform for these two contrasting hurricanes? • Variables Input: • Vmax = 130 kt • Speed = 17 kt • Radius of 34 kt = 60 nm • POCI = 1012 mb • Latitude = 26N • Dvorak = 932 mb • Knaff-Zehr = 939 mb • Actual = 941 mb
Recommendations Develop PC-based tool for obtaining MSLP given Vmax, latitude, speed, POCI, and R34 (or obtain Vmax given MSLP and others). Adopt Knaff-Zehr pressure-wind relationship as official standard (retiring Dvorak’s P-W) Integrate Knaff-Zehr P-W relationship into ATCF to provide HS/SHS with recommended MSLP given the inputs above. (However, HS/SHS still – as always – makes final call on central pressure analysis.)
Current Pressure-Wind Relationships – Substantial Variability
Revised pressure-wind relationship – Courtney and Knaff (2009)