Download
1 / 31
310 likes | 439 Vues
Village of Shorewood. Visioning Update – 2013-14. Vision. Shorewood will be a desirable community that continues to attract and retain residents who value Shorewood’s community assets and rich diversity. Marketing Vision.

E N D
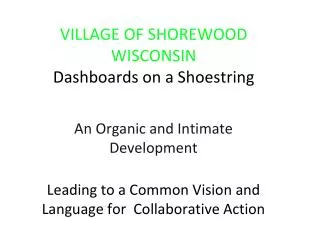
Village of Shorewood Visioning Update – 2013-14
Vision Shorewood will be a desirable community that continues to attract and retain residents who value Shorewood’s community assets and rich diversity.
Marketing Vision Shorewood is generally understood to be the most desirable area in Metro Milwaukee in which to live, raise a family, and locate a business.
Promote vibrant urban housing Protect & enhance property values Deliver quality services at a competitive tax rate Maintain a safe, walkable, small-town urban living experience Remain committed to open, interactive communication Protect & enhance our environment Protect & enhance public green spaces Collaborate to promote educational excellence Implementation Plan Goals
Infrastructure Challenges • Street surfaces • Alleys • Watershed protection • Public • Private • Parking – private and public
2008 Public Funding Priorities: Irrelevant Now • Raise taxes: 69% • Maintain taxes: 17% • Lower taxes: 12% • Raise taxes only: 27% • Raise taxes/ fees/charges: 35% • Use alley special assessments: 54% Resident Survey 2008
Renters/Owners Data in 2010 • < 35 years old • 27.3% of total • 11.5% owners • 42.3% renters • 35-44 years old • 16.6% of total • 20.9% owners • 12.6% renters • 45-54 years old • 17.7% of total • 25.6% owners • 10.2% renters • 55-64 years old • 15.8% of total • 20.6% owners • 11.3% renters
Families Data to Ponder • 2000 • 49% of HH are NOT families • 40% live alone • 25% of family HH have children <18 • 52% are renters • 2010 • 51.3% of HH are NOT families • 39% live alone • 22.6% of family HH have children < 18 • 53% are renters
Though still not shrinking dramatically… • 2000 • Population up in ages 5-19 • Population up in ages 45-64 • 2010 • Population down in ages 5-19 • Population up in ages 55-69
Typical New Home (from NAHB) 1900 1950 1,000 SF or less 2 bedrooms 1 bathroom One story 815 homes built in Shorewood during 1950’s • 700-1,200 SF • 2-3 bedrooms • 0-1 bathroom • Two stories 3,642 homes built in Shorewood <1940
Typical New Home (from NAHB) 2000 2012 2,226 SF (median) 2,494 for 35 and under 2,065 for 65 and older 2,150 SF (Midwest suburb) 3 bedroom 2 ½ bathrooms DR + 3 add’l rooms Garage & A/C Shopping w/in 15 min. • 2,265 SF • 3 or more bedrooms • 2 ½ bathrooms • Garage for 2+ cars • Center A/C • 1 Fireplace • Two stories 146 built in Shorewood
Rebecca Ryan Futurist
Rebecca Ryan, for the Economist “Gigs, Gazelles, and Makers” http://www.nextgenerationconsulting.com/the-future-of-the-u-s-economy-gigs-gazelles-and-makers/
Rebecca Ryan for Cities “Relocating? Four Keys to Choosing a Great City” http://www.nextgenerationconsulting.com/anatomy-of-a-relocation/
Rebecca Ryan: Handprint Indices • Vitality • Earning • Learning • Social Capital • After Hours • Cost of Lifestyle • Around Town
Be the right things to the right people Not all things to all people When the “winter” is over What does our location offer? Can we change what we offer? Should we change what we offer? Leadership Challenge
Leadership Challenge • Who will be the right people for the next decade? • What do/will they want?
Location, location, location Jobs Cost of living Sunshine Education Air/water quality Healthcare costs Crime rate Daily commute time Auto costs Leisure amenities
Promote vibrant urban housing Protect & enhance property values Deliver quality services at a competitive tax rate Maintain a safe, walkable, small-town urban living experience Remain committed to open, interactive communication Protect & enhance our environment Protect & enhance public green spaces Collaborate to promote educational excellence Change Implementation Plan Goals?
Promote vibrant urban housing Protect & enhance property values Deliver quality services at a competitive tax rate Maintain a safe, walkable, small-town urban living experience Remain committed to open, interactive communication Protect & enhance our environment Protect & enhance public green spaces Collaborate to promote educational excellence Be more specific about strategic goals: “Right things for the right people”
Vibrant Urban Living Experience Who should we ask to define what they want? Tapestry segmentation we have? That we want? What about school age kids in flat/declining future?