Download
1 / 10
100 likes | 220 Vues
This report delves into pre-harvest pricing strategies for corn and soybeans from 1998 to 2001. It emphasizes that historical performance does not assure future results, illustrating with a detailed breakdown of hedging outcomes using puts and synthetic puts. Analyzing average gains and losses reveals the importance of timing in lifting hedges. With specific focus on pricing dates and market reactions to weather and crop conditions, this study serves as a guide for farmers and investors on effective marketing strategies in the agriculture sector.

E N D
Pre-harvest pricing results • Corn (C. Iowa) Soybeans • HedgedPutsHedgedSyn. Put • 1998 + $0.49 $0.27 +$0.69 $0.39 • 1999 +0.31 +0.34 -0.14 -0.23 • 2000 +0.44 +0.41 +0.86 +0.47 • 2001 +0.17 +0.05 +0.10 +0.40* • Avg. +0.35 +0.27 +0.38 +0.26 • Avg. impact/yr., 1000 A., 75% sold: • Hedge +$27,800 Options +$20,060 • Synth. Put, call lifted Aug. 9
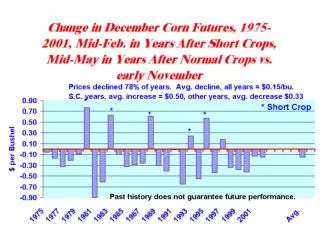
Pricing Strategy Results, Corn & SoybeansR. Wisner, ISU Econ. • Pricing time: 3rd Thursday of May if Previous U.S. Crop was Normal • After Weather-induced Short U.S. Crop, Price Last Week of February. • Puts lifted in Sept.-Oct. • Synthetic Puts (hedge & buy calls) lifted in early August
New-crop Corn Pricing opportunities, 2001 Dec. Futures • May 17: Dec. Fut. $2.20 • May 17: $2.20 Put: $.153 $2.10 put: $.103 $2.30 Puts: $.216 • Nov. 8: Dec. Fut.: $2.03, $2.20 Put: $.176 $2.10 put: $.085, $2.30 put: $.273 • Gains: Hedge: +$0.17 • $2.10 put: -$0.02 • $2.20 put:+$0.02 • $2.30 put:+$0.055
New-crop Soybean Pricing opportunities, 2001 Nov. Futures • May 17: $4.38 $4.40 call =$.265, Put =$0.285 • Oct. 18: Fut.$4.31 $4.40 call: $.002,put: $.120 Oct. 25: $4.28 • Hedge gain: $0.07-$0.10/bu. • Options losses: Call: -$.265, Put: -$.17 Lifting calls Aug. 9: Nov. fut. $5.05, Calls: +$0.67 Gain from calls: $0.40 • Nov. Beans, Feb. 22, 01 = $4.63
Optimum Time to Place a HedgeNovember Soybeans, 1975-01Avg. Gain, $/bu. • 1st Week of April vs. 3rdWk. Of May -$0.01 • 2nd Week of April vs. 3rd Wk. Of May -$0.02 • 3rd Week of April vs. 3rd Wk. Of May -$0.00 • 4th Week of April vs. 3rd Wk. Of May -$0.03 • 4th Week of May vs. 3rd Wk. Of May -$0.02
Optimum Time to Lift a HedgeNovember Soybeans, 1975-01Avg. Gain, $/bu. 4th Week of Sept. vs. 2nd Wk. Of Oct. -$0.06 1st Week of Oct. vs. 2nd Wk. Of Oct. -$0.08 3rd Week of Oct. vs. 2nd Wk. Of Oct. +$0.02 4th Week of Oct. vs. 2nd Wk. Of Oct. +$0.05