Download
1 / 30
300 likes | 411 Vues
Explore data sources, monthly and weekly climate products, extreme climate monitoring, and impacts on disasters and global climate through CPD/JMA. Access global climate information at TCC Homepage.

E N D
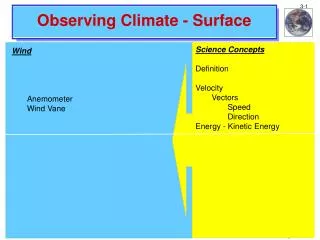
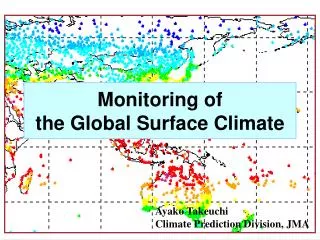
Monitoring ofthe Global Surface Climate Ayako Takeuchi Climate Prediction Division, JMA
Outline 1. Introduction 2. Data Source 3. Monthly Products 4. Weekly Products
Prediction Monitoring Surface Climate Climate System Products of CPD/JMA Climate Information Impacts Disasters
Needs for Global Climate Information • Climate Change • Increase of climate extremes • Globalization of socio-economical activities • Foods security • International disaster relief
Contents of CPD Global Climate Information MONTHLY PROCUCTS Figures ・Temperature anomaly ・Normalized temperature anomaly ・Precipitation ratio ・Precipitation quintile ・Extreme climate Comments (Highlight, Extreme climate) Data Lists WEEKLY PRODUCTS Figures ・Extreme climate and weather disaster ・Reference data (Temperature and its anomaly Precipitation and its ratio Atmospheric circulation and convection) Comment ・Name of extreme climate and area ・Damage from disaster
・Collection and quality check of meteorological data ・Identification of extreme climate events ・Analysis of the relations with general circulation ・Weather disaster information CLIMAT messages(1500) SYNOP messages (4000-5000) Reports (temperature, precipitation, extreme climate events) Objective Analysis Data of Meteorological Satellites Monthly Weekly Database of weather disasters TCC Home Page Process of making Global Climate Information
CLIMAT and SYNOP Main Source of Products CLIMAT messages reporting monthly value (Surface Pressure, Temperature, Precipitation, etc.) CLIMAT and SYNOP messages are exchanged via the GTS SYNOP messages reporting present value 4 times a day
JMA’s Definition of Extreme ClimateThe Criteria for Monthly Data EXTREME CLIMATE The phenomenon that would occur once in about 30 years EXTREME MONTHLY CLIMATE Temperature : the normalized anomaly ≧2 the normalized anomaly≦-2 the normalized anomaly = anomaly / standard deviation Precipitation : Quintile = 6 or 0 Quintile 6 : the precipitation is greater than any value in 1971 - 2000 0 : the precipitation is less than any value in 1971 - 2000 Climatological normals are calculated from the statistics of 1971 - 2000 data.
Where can you get CPD Global Climate Information? TCC Homepage (URL) for Meteorological Services http://cpd2.kishou.go.jp/tcc/
Products of monitoring of surface climate Monthly Mean Temperature Anomaly
Products of monitoring of surface climate Monthly Mean Temperature Anomaly (normalized) Category
Products of monitoring of surface climate Monthly Precipitation Category
Products of monitoring of surface climate Monthly Precipitation Ratio Category
Products of monitoring of surface climate Monthly Precipitation Quintle
Products of monitoring of surface climate Monthly Extreme Climate (October 2003) 1. Heavy precipitation in central Siberia 2. Heavy precipitation in northern China 3. Heavy precipitation in Southeast Asia 4. Heavy precipitation from southwestern Russia to northwestern Africa 5. Low temperature in central Europe 6. High temperature in western Africa 7. High temperature in southeastern Africa 8. High temperature and heavy precipitation from Greenland to northeastern Canada 9. High temperature from middle-western to western USA 10. Heavy precipitation in Mexico 11. High temperature around the Caribbean Sea 12. High temperature in northern Argentina 13. Light precipitation in central Argentina 14. Low temperature in southeastern Australia • Products for monthly climate • Using CLIMAT message Distribution of Extreme Monthly Climate
Daily precipitation estimated from SYNOP Quality Check for SYNOP data • Products for weekly climate • Using SYNOP messages Example of quality check for SYNOP data Monthly precipitation estimated from SYNOP 0mm CLIMAT precipitation 15mm We use this observatory’s data carefully.
Weekly Extreme Climate EXTREME CLIMATE The phenomenon that would occur once in about 30 years The criteria are decided from research for Japanese observatories. Temperature : the normalized anomaly ≧3 : WARM the normalized anomaly≦-3 : COLD the normalized anomaly = anomaly / 30-day standard deviation anomaly = weekly mean temperature - weekly normal Precipitation : precipitation in a week exceeds the 30-day normal : WET precipitation in the last 30-day is less than the threshold of quintile 1 for the 30-day : DRY EXTREME MONTHLY CLIMATE Temperature : the normalized anomaly ≧2 the normalized anomaly≦-2 the normalized anomaly = anomaly / standard deviation Precipitation : Quintile = 6 or 0 Quintile 6 : the precipitation is greater than any value in 1971 - 2000 0 : the precipitation is less than any value in 1971 - 2000 Weekly normal, 30-day normal, 30-day standard deviation and 30-day quintile are calculated by interpolating monthly values of the previous (or following) and the current month. Monthly normals are calculated from the statistics of 1971 - 2000 data.
1 October, 2003 Japan Meteorological Agency Weekly Report on Global Extreme Climate Events ( 24 September, 2003 - 30 September, 2003 ) Extreme weather and climate events and/or weather disasters in this period are as follows ; 1. Wet : northern China 2. Warm : central China 3. Cold : northwestern China to eastern Kazakhstan 4. Wet : northern and central India 5. Wet : northern Algeria, Tunisia and northern Italy 6. Warm : northeastern USA and eastern Canada to southern Greenland 7. Hurricane : eastern Canada Hurricane “Juan” made landfall on eastern Canada on 29 September. In eastern Canada, fatalities caused by Hurricane were reported. 8. Warm : western USA 9. Dry : eastern Australia 10. Wet : southwestern Australia Products of monitoring of surface climate Distribution of Extreme Weekly Climate
Reference figure for weekly climate 500hPa height and anomaly(m) 850hPa wind vector, OLR and its anomaly(W/m2)
Reference figure for weekly climate Weekly temperature anomaly(℃) Weekly precipitation ratio(%)
Reference : Quintile The 30 monthly values of precipitation, the statistical period of calculation for climatological normals, are listed in ascending order. The list is then divided into five groups of quintiles of six values each. The first quintile contains the lowest 6 values and the fifth quintile contains the highest 6 values. Example 60.0mm => quintile 1 220.0mm => quintile 4 420.0mm => quintile 6