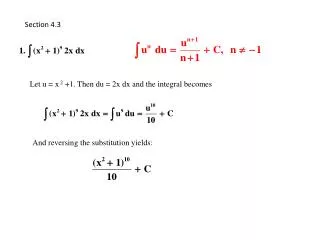
Section 4.3
Section 4.3. Connecting f’ and f’’ with the graph of f. First derivative test for local extrema. Theorem 4 : First Derivative Test for Local Extrema : The following test applies to a continuous function f(x ). At a critical point c :


Section 4.3
E N D
Presentation Transcript
Section 4.3 Connecting f’ and f’’ with the graph of f
First derivative test for local extrema • Theorem 4: First Derivative Test for Local Extrema: • The following test applies to a continuous function f(x). • At a critical point c: • If f’ changes sign from positive to negative at c, then f has a local maximum value at c.
First derivative test for local extrema • If f’ changes sign from negative to positive at c, then f has a local minimum value at c. • If f’ does not change sign at c, then f has no local extreme value at c.
First derivative test for local extrema • At a left endpoint a: • If f’ < 0 (f’ > 0) for x > a, then f has a local minimum (maximum) value at a. • At a right endpoint b: • If f’ < 0 (f’ > 0) for x < b, then f has a local minimum (maximum) value at b.
Example 1 • For each of the following functions, use the First Derivative Test to find the local extreme values. Identify any absolute extrema.
Example 2 • For each of the following functions, use the First Derivative Test to find the local extreme values. Identify any absolute extrema.
concavity • Definition 1: The graph of a differentiable function is • concave up on an open interval I if y’ is increasing on I. • concave down on an open interval I if y’ is decreasing on I.
concavity • Concavity Test: The graph of a twice-differentiated function is • Concave up on any interval where y’’ > 0. • Concave down on any interval where y’’ < 0.
Example 3 • Use the Concavity Test to determine the concavity of the given functions on the given intervals.
Example 4 • Use the Concavity Test to determine the concavity of the given functions on the given intervals.
Example 5 • Use the Concavity Test to determine the concavity of the given functions on the given intervals.
Points of inflection • Definition 2: A point where the graph of a function has a tangent line and where the concavity changes is a point of inflection. y’’ = 0
Example 6 • The graph of the derivative of a function f on the interval [-4, 4] is shown below. Answer the following questions about f, justify each answer with information obtained from the graph of f’. • One what intervals is f increasing? • On what intervals is the graph of f concave up? • At which x-coordinates does f have local extrema? • What are the x-coordinates of all inflection points of the graph of f? • Sketch a possible graph of f on the interval [-4, 4].
Example 7 • A particle is moving along the x-axis with position function x(t). Find the (a) velocity and (b) acceleration, and (c) describe the motion of the particle for t ≥ 0.
Example 8 • The table below shows the population of Pennsylvania in each 10-year census between 1830 and 1950. • Find the logistic regression for the data. • Graph the data in a scatter plot and super- impose the regression curve. • Use the regression equation to predict the Pennsylvania population in the 2000 census. • In what year was the PA population growing the fastest? What significant behavior does the graph of the regression equation exhibit at that point. • What does the regression equation indicate about the population of PA in the long run?
Second derivative test for local extrema • Theorem 5: Second Derivative Test for Local Extrema: • If f’(c) = 0 and f’’(c) < 0, then f has a local maximum at x = c. • If f’(c) = 0 and f’’(c) > 0, then f has a local minimum at x = c.
Example 9 • Find the local extreme values of
Example 10 • Let . • Identify where the extrema of f occur. • Find the intervals on which f is increasing and the intervals on which f are decreasing. • Find where the graph of f is concave up and where it is concave down. • Sketch a possible graph for f.