Download
1 / 23
230 likes | 410 Vues
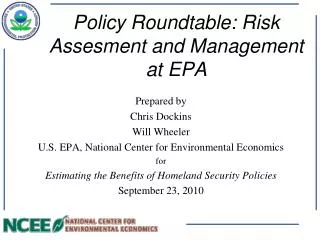
Policy Roundtable: Risk Assesment and Management at EPA. Prepared by Chris Dockins Will Wheeler U.S. EPA, National Center for Environmental Economics for Estimating the Benefits of Homeland Security Policies September 23, 2010. EPA Risk Assessment Documents. 2008. The “Red Book”

E N D
Policy Roundtable: Risk Assesment and Management at EPA Prepared by Chris Dockins Will Wheeler U.S. EPA, National Center for Environmental Economics for Estimating the Benefits of Homeland Security Policies September 23, 2010
EPA Risk Assessment Documents 2008 The “Red Book” Defines the risk assessment / risk management framework
Roles of Risk Assessment Risk Assessment Risk Management Risk Assessment - cancer - non-cancer Policy Decision - standards - information Protective
Roles of Risk Assessment Risk Assessment Risk Management Risk Assessment - cancer - non-cancer Policy Decision - standards - information Protective • Economic Analysis • benefit-cost analysis • cost effectiveness • economic impacts Predictive Public Information
Overlaying the frameworks Typical tasks for Risk Assessment Typical tasks for Economists
Overlaying the frameworks Choices in risk assessment constrain the economic analysis Typical tasks for Economists
Overlaying the frameworks Choice of endpoint(s) Risk or hazard measure Estimating risk changes Typical tasks for Economists
RABA Project Assemble a team to develop risk assessments for benefits analysis (RABA) Toxicologists, biostatisticians, economists, epidemiologists Begin with some mutual education Base the analysis on actual data from a known (but undisclosed) chemical “Chemical T” Known mode of action Cancer and non-cancer effects Make assumptions about exposure Develop benefit-transfer estimates for benefits.
Objects of Choice / Endpoint(s) • Defining outcomes compatible with economic benefits analysis that could be inferred from analysis of animal data • Change in liver weight was the most sensitive effect • Usual approach would be to focus on liver weight or on T4/TSH hormone levels • Extensive discussion move from modeling T4/TSH to modeling an outcome (hypothyroidism) that is amenable to valuation • Chemical T is also a carcinogen
Quantitative Measure noncancer Reference Doses and Reference Concentrations are not risk estimates - but rather safety assessments dose without “appreciable” risk of adverse effects Reference dose tells us nothing about risks What are the benefits of moving from must above to just below? What are the benefits of additional reductions below the RfD? Need to relate continuous data to probably of hypothyroidism Approach: define 95th percentile TSH in controls as representing effect (hypothyroidism); sensitivity analysis of selected cutoff (Gaylor & Slikker 1990 method)
Change in Objects of choice / Estimating Risk Changes Cancer potency values (particularly those using animal data) are generally derived by: estimating a “Point of Departure” - a lower-bound estimate of the dose associated with a particular level of tumor incidence (typically 10%) drawing a straight line from the POD to the origin These procedures are generally characterized as producing an “upper-bound” estimate of cancer risk assumption of low-dose linearity and lower-bound POD is not a central estimate These may also be combined with “upper bound” exposure assessments The resulting values will bias benefits analysis if used directly
Cancer Hypothyroidism 0.6 0.4 %Lifespan = 0.1 Probability of Effect 0.2 %Lifespan = 1.0 0.0 2.5 0 5 10 15 20 25 30 Human Equivalent Dose (mg/kg/d) Cancer and non-cancer risks for valuation Combined with assumed (central) exposure parameters and benefit-transfer we can estimate benefits The process and the outcome are not standard under our current framework
Next for EPA’s Framework October EPA Risk Assessment Forum colloquium to evaluate “Silver Book” recommendations, including revising EPA’s framework for risk assessment and management emphasis on improving the utility of risk assessment economic analysis is part of the discussion Some exploratory analyses for upcoming rulemakings
Pros and Cons In some situations risk paradigm has been very successful Some programs can justify their rules based on a risk assessment plus benefit-cost analysis very easily E.g., EPA’s air office Relatively easy-to-model risk Relatively few pollutants However, other programs within EPA have not been able to monetize benefits as easily Tendency for risks that are not measured to drop out of consideration entirely Heavy reliance on risk paradigm can squeeze out other approaches Inertia, ingrained culture, and incremental budgeting can get you stuck
SDWA Rule: Disinfection Byproducts 1997 rule that controlled ‘leftovers’ in drinking water from treatment (e.g., chlorine) Range of cancer risk: 1 case to 10,000 cases annually This range of uncertainty led EPA to perform two additional analyses: breakeven and regrets analysis Compared “no action,” regulatory alternative, and a stronger option
Breakeven analysis Take what you (assume) you know the most accurately and see what the levels of what you do not know have to be to break even Used when you know (e.g.) costs and value of risk reduction, but not actual risk Calculate cost and value of risk reduction What is the risk reduction that allows you to break even? Is this risk reduction believable/reasonable? Regulatory option would need to reduce 438 cancer cases per year to break even Towards the low end of the 1-10,000 case range
Regrets Analysis If you are wrong about risk, which option minimizes the damage Used when there is a lot of uncertainty about risk Calculate cost and value of forgone risk reduction for different policies and level of risk What option minimizes losses for each alternative? Worst losses No action: $4 billion Regulatory alternative: $0.7 billion Stronger option: $2.9 billion
EPA Employment EPA founded in 1970 Numerous statutory authorities Risk Assessment gradually took hold Cost-benefit requirements in the 1980s Distribution of employees may not reflect new mandates
EPA’s Office of Research and Development EPA’s Office of Research and Development used the risk assessment paradigm in their 1996 Strategic Plan Funding depended on contributions to reducing uncertainty in risk assessment Economics hovered around one-third of one percent of research budget Incremental budgeting also a factor 2001 Strategic Plan dropped this approach Ecological Research Program recently adopted view of including economists Can also blame inertia and incremental budgeting
Our Advice Decide where you want to be down the road and plan how to get there Do not get stuck where you do not want to be