Download
1 / 44
450 likes | 726 Vues
Current trends in quantitative proteomics. Afshan Jabeen. What are we covering?. Mass Spectrometry Mass Spec Data Analysis Biomarker Identification and Validation Quantitative Proteomics Challenges /Performance goals Techniques in Proteomics

E N D
Current trends in quantitative proteomics AfshanJabeen
What are we covering? • Mass Spectrometry • Mass Spec Data Analysis • Biomarker Identification and Validation • Quantitative Proteomics • Challenges /Performance goals • Techniques in Proteomics • Techniques in Quantitative Proteomics • Absolute Quantification • Relative Quantification • Challenges in Quantitation • References
Genome VS Proteome The genome of an organism — its DNA — never changes. It’s the collection of all genes within an organism. By itself the genome does not specify everything that happens within the organism. In contrast, A proteome is the sum of all the proteins in an organism. Proteins are responsible for an endless number of tasks within the cell. The proteome changes all the time, amount of each individual protein varies constantly. The measure of their expression level is in direct connection with their activity. Also proteins can be exported out of the cell into various biological fluids that are easy to sample Peptides → Polypeptides → Protein molecules
Mass Spectrometry Mass spectrometry is a technology recently used for the separation and large-scale detection of proteins present in complex biological mixture. The MS principle consists of ionizing chemical compounds to generate charged molecules or molecule fragments and measurement of their mass-to-charge ratio. In a typical MS procedure: • A sample is loaded onto the MS instrument, and undergoes vaporization • The components of the sample are ionized by one of a variety of methods (e.g., by impacting them with an electron beam), which results in the formation of charged particles (ions) • The ions are separated according to their mass-to-charge ratio in an analyzer by electromagnetic fields • The ions are detected, usually by a quantitative method • The ion signal is processed into mass spectra
What have we covered? • Mass Spectrometry • Mass Spec Data Analysis • Biomarker Identification and Validation • Quantitative Proteomics • Challenges /Performance goals • Techniques in Proteomics • Techniques in Quantitative Proteomics • Absolute Quantification • Relative Quantification • Challenges in Quantitation • References
Protein MS Data Analysis Data acquisition leads to various sources of experimental noise. The observed signal can thus be decomposed into several components. • The biological signal of interest • A normalization factor • A baseline usually attributed to ionized molecules hitting the detector, energy overhead • Random noise from the electronic measuring system or of chemical origin This data needs to pre-processed to isolate the true signal that needs to be studied As we will see, the quality of the samples and pre-analytical steps is crucial in protein MS data analysis
Pre-processing • Noise filtering The x-axis can be various m/z values and y-axis could be the number of ions that hit the detector at that m/z value
Pre-processing • Baseline correction – Baseline can be part of the signal remaining after features of interest have been removed or some kind of smooth curve underlying the spectrum
Pre-processing • Alignment of spectra – When comparing two spectra (the reference spectrum and the observed spectrum) from the Mass Spectrometer, a shift on the axes can occur. For reliable identification of features, one needs to carefully associate each feature of interest with a specific m/z. To be able to make sense out of the comparison, there needs to be a correlation between the two spectra. • Normalization – A normalization step is necessary to ensure comparable spectra on the intensity scale. Normalization tends to account for differences in the samples. The idea is to consider the total amount of protein is roughly the same between samples. • Once the signal is cleaned, the features of interest need to be found/inferred.
What have we covered? • Mass Spectrometry • Mass Spec Data Analysis • Biomarker Identification and Validation • Quantitative Proteomics • Challenges /Performance goals • Techniques in Proteomics • Techniques in Quantitative Proteomics • Absolute Quantification • Relative Quantification • Challenges in Quantitation • References
Biomarker identification and validation • After each spectrum is cleaned and characterized by a finite common number of peaks, biomarker discovery analysis then aims to detect which of these peaks are associated with factors of interest. • Identification studies then aim to select a list of candidate biomarkers and to estimate the strength of association between those candidate biomarkers and disease status or outcome. • Validation studies aim to retain the confirmed biomarkers from previously selected candidates and to re-estimate the strength of association between these biomarkers and disease status or outcome.
What have we covered? • Mass Spectrometry • Mass Spec Data Analysis • Biomarker Identification and Validation • Quantitative Proteomics • Challenges /Performance goals • Techniques in Proteomics • Techniques in Quantitative Proteomics • Absolute Quantification • Relative Quantification • Challenges in Quantitation • References
Why Quantitative Proteomics? • Mass spectrometrists were able to tell biologists which proteins were present in a certain sample • Because proteins are created from genes, but the amount of a given protein is controlled by the environment, proteomics can shed useful information on the whole spectrum of diseases. Now, there was a need to measure the amount of proteins in different samples • This approach can be used to compare sample from healthy and diseased patients • Investigating changes in host protein concentration during an infection (condition) • Observing protein expression under changing environmental conditions
Proteomics Applications • Scientific Knowledge - Proteomics has been used to study basic biological questions. For example, what is the structure of the pores between the nucleus and the cytoplasm of a cell? • Diagnosis - Proteomics has looked at tumor biopsies and blood samples for indicators of cancer, birth defects, and other medical conditions. One diagnostic challenge is distinguishing between disorders with similar symptoms, but requiring different treatments. • Monitoring - Proteomics can also search for biomarkers that indicate the stage of a disease, or the response of the patient to treatment. • Drug Discovery - Most drugs target proteins, so it makes sense to use proteomic techniques to search for drug candidates.
What have we covered? • Mass Spectrometry • Mass Spec Data Analysis • Biomarker Identification and Validation • Quantitative Proteomics • Challenges /Performance goals • Techniques in Proteomics • Techniques in Quantitative Proteomics • Absolute Quantification • Relative Quantification • Challenges in Quantitation • References
Challenges in Proteomics • Current protein biomarkers do not have sufficient sensitivity and specificity to predict the development of a particular form of disease and accurately detect it at an early stage • A biomarker can be attributed to many different sources, there is a need to unambiguously detect and quantify proteins • Techniques used in plasma proteomics are able to sample only a relatively small fraction of the proteome that mostly consists of relatively highly expressed proteins • Comprehensive protein analysis is challenging so long as high abundance proteins mask lower abundance proteins • Protein biomarker discovery strategies need improved analytical sensitivity, robustness and sample throughput to detect protein patterns with high specificity
Challenges in Proteomics • Proteomic platform should have the capacity for the automated, repetitive and reproducible analysis of hundreds of patient samples in relatively short period of time and in a cost-effective manner • Repetitive measurements during the protein biomarker discovery process should not lead to high variance • Standardized protein biomarkers as measurable disease predicting indicators is further complicated due to the genetic variation among individuals • Proteome itself is constantly changing over time. In such a case it is harder to define a “normal” protein levels in a healthy individual.
Tissue VS Plasma proteomics • Protein concentration range in tissue is lower than in blood • Investigation at the origin of the disease • Protein abundance ratio changes in tissue compared to blood are also expected to be higher and thus easier to detect • It is unlikely that human tissues will be routinely analyzed in large populations • Blood collects cues consisting of proteins secreted, shed or otherwise released from tissues • Blood plasma contains an information network about the state of the organs and the whole organism in health and disease • It is easier to access biological fluids such as blood as opposed to tissue samples
What have we covered? • Mass Spectrometry • Mass Spec Data Analysis • Biomarker Identification and Validation • Quantitative Proteomics • Challenges /Performance goals • Techniques in Proteomics • Techniques in Quantitative Proteomics • Absolute Quantification • Relative Quantification • Challenges in Quantitation • References
Techniques in Proteomics Two general schemes: those that involve the use of labels and those methods that are label-free. • Techniques that use labels are based on labeling substances by including unusual isotopes in their chemical composition. If these unusual isotopes are later detected either due to mass shifts or the way they react chemically then it indicates the presence of the labeled substance. • Label-free quantification is a method in mass spectrometry that aims to determine the differential expression level of proteins in two or more biological samples. Unlike other methods for protein quantification, label-free quantification does not use a stable isotope containing compound to chemically bind to and thus label the protein.
Quantitation using stable isotope-labeled tags • A protein occurs in higher copy number in cell state 1 than in cell state 2. • After digestion with trypsin (breaks down proteins into peptides), the protein extracts are mixed and peptides under study are selectively retrieved • Peptides are measured by mass spectrometry, and the otherwise identical peptides will be separated in a mass spectrum by the mass difference between the labeled and unlabeled reagent
Label-Free Quantitation • Because of the expense and effort required for use of some of the labeling techniques, there seems to be a trend toward label-free quantitation. Pros • Requires no labeling steps • Eliminates need for costly reagents • Does not require multistep labeling protocols which can lead to irreproducibility and loss of target peptides. Cons • Greater need for reducing potential interferences that could lead to suppression effects – leading to concerns on the reliability of label-free quantitative analysis • Label-free approaches do not allow for sample multiplexing – each sample has to be analyzed individually
What have we covered? • Mass Spectrometry • Mass Spec Data Analysis • Biomarker Identification and Validation • Quantitative Proteomics • Challenges /Performance goals • Techniques in Proteomics • Techniques in Quantitative Proteomics • Absolute Quantification • Relative Quantification • Challenges in Quantitation • References
Quantitation Quantitation can be done by comparing key characteristic ions from the labeled and unlabeled standard with respect to the peak heights or peak areas of labeled and unlabeled analytes. • Absolute quantitation – determine changes in protein expression in terms of exact amount or concentration of each protein present • Relative quantitation – determine the up- or down-regulation of a protein relative to the control sample Note: Absolute quantitation is relative – relative to an internal standard. For absolute quantitation the absolute amount of material in the reference sample must be known. This means that standard known amounts of the target proteins or peptides must be available for all targeted analytes.
Targeted Absolute Quantitation • Selected ion monitoring (SIM) technique – In selected ion monitoring the mass spectrometer is set to scan over a very small mass range, typically one mass unit (instead of scanning all m/z values). The narrower the mass range the more specific the result is. The SIM plot is a plot of the ion current resulting from this very small mass range. Only compounds with the selected mass are detected and plotted. • Selected reaction monitoring (SRM) technique – SRM delivers a unique fragment ion that can be monitored and quantified in the midst of a very complicated matrix. Only a selected peptide (precursor) is allowed to pass through. Inside the collision cell, peptide disassociates into fragments specific to the precursor peptide. SRM plots are very simple, usually containing only a single peak. This characteristic makes the SRM plot ideal for sensitive and specific quantitation.
Advantages • Because of the presence of internal standard, more accurate expression ratios can be calculated. • For an experiment with multiple treatments, the use of internal standard ensures that all of the treatments can be compared with each other. • Internal standard corrects irreproducibility in sample processing. • Analysis with labeled internal standards is capable of sensitive and absolute determination of peptide concentrations across a wide dynamic range. • The amount of internal standard added for each peptide can be optimized to obtain low coefficients of variation.
Disadvantages • Sample complexity can limit the sensitivity of the technique to detect low-abundance proteins in the presence of high-abundance proteins • Abundant proteins in serum and plasma can be depleted using immunoaffinity columns (these are antibodies with binding affinities for specific target analytes), however depletion suffers from problems – • Only 80%-90% of the targeted proteins will be removed, therefore it is still possible to have excess of abundant proteins • Non targeted proteins which bind to targeted proteins can be removed as well • Antibody columns recognize proteins in their native conformations, while protocols to extract proteins from the sample may denature them • Alternative to immuno-depletion is enriching the sample
Relative Quantitation • Relative quantitation is based on the introduction of a chemically equivalent differential mass tag that allows comparative quantitation of proteins in one sample to another. • Different isotopic labels can be introduced metabolically, enzymatically or chemically at either the peptide or the protein level. • The labels change the mass of the protein or peptide without affecting the analytical or biochemical properties.
Metabolic vs. Non-Metabolic Labeling • In vivo - Isotope-enriched compounds (salts or amino acids) are added to the growth media that can be metabolized by the cell and incorporated into proteins. • Limited to situations where the cells are metabolically active • Produces the lowest variation before any sample processing occurs • Samples grown with different amino acids can be pooled prior to sample preparation and analysis steps • Due to the cost involved, this is used for pathway determination • In vitro - In vitro labeling can be established using chemical derivatization of proteins or peptides after protein extraction. • Non-metabolic labeling occurs after protein extraction and therefore is completely independent of the source and preparation of the sample. • Time needed for the labeling is shorter • Higher levels of variation can happen due to parallel sample processing • This is used for biomarker discovery
Chemical Labeling ICPL – Isotope coded protein label, based on isotopic labeling of all the free amino groups in proteins. Proteins derived from two different cells or tissues are extracted and differentially labeled at the free amino groups with isotope encoded (heavy) or isotope free (light) ICPL tags. Since identical peptides derived from each sample are modified with the heavy or the light ICPL label, respectively, they differ in mass and consequently appear as doublets in the MS spectra. The ratios of the peak intensities for these labeled peptide pairs provide relative quantitative information about the amount of their parent proteins in the original sample. H3/D3Acetylation or H5/D5propionylation – similar in concept to the ICPL technique except that proteins are labeled with different chemical compounds
Chemical Labeling ICAT – method for quantitative proteomics that relies on chemical labeling reagents (probes) referred to as ICATs. The probes contain • A reactive group for labeling • A linker that contains heavy or light variants • A tag to isolate modified peptides For the quantitative comparison of two proteomes, one sample is labeled with the isotopically light probe and the other with the isotopically heavy version. To minimize error, both samples are then combined, digested with a protease, and subjected to some method to isolate peptides labeled with isotope-coded tagging reagents. These peptides are then analyzed by MS. The ratios of signal intensities of differentially mass-tagged peptide pairs are quantified to determine the relative levels of proteins in the two samples.
iTRAQ & mTRAQ mTRAQ – a new amine-reactive isotope coded reagent which is designed to be used after the biomarker discovery stage, during the validation stage. iTRAQ – used to quantify proteins from different sources in one single experiment. Unlike ICAT it can used to analyze up to 4 different samples using 4-plex kit or samples using 8-plex kit. In iTRAQ labeling is done at the peptide level, therefore multiple peptides can be detected for the same protein thus giving multiple quantitation measurements per protein and increasing the confidence of protein identification
What have we covered? • Mass Spectrometry • Mass Spec Data Analysis • Biomarker Identification and Validation • Quantitative Proteomics • Challenges /Performance goals • Techniques in Proteomics • Techniques in Quantitative Proteomics • Absolute Quantification • Relative Quantification • Challenges in Quantitation • References
Challenges • All peptide based quantitation techniques assume that protein can be digested into the peptides and these peptides are detectible by the mass spectrometric technique used for analysis • Using peptide quantitation as a means of protein quantitation also assumes that the digestion is complete and that it is reproducible (i.e. one peptide = one protein). Therefore optimizing protein digestion conditions for reproducibility and completeness is still an active area of research • Mass Spectrometry based quantitation also poses statistical challenges. Because of high cost per analysis and limited amounts of sample the issues of biological variability (samples from different patients or animals), technical variability (the same biological sample split and processed independently) and experimental variability (different analyses of the same processed sample) have not been addressed
Challenges • Also, at this point, there is no single method that will identify and quantitate all of the proteins in the sample – different techniques will find different proteins
What have we covered? • Mass Spectrometry • Mass Spec Data Analysis • Biomarker Identification and Validation • Quantitative Proteomics • Challenges /Performance goals • Techniques in Proteomics • Techniques in Quantitative Proteomics • Absolute Quantification • Relative Quantification • Challenges in Quantitation • References
15N Labeling 15N labeling – is a metabolic labeling technique applied to MS-based proteomic analysis. In involves introducing a stable non-radioactive isotope of nitrogen in the growth medium. Pros • Good choice for autotrophic organisms (organisms that can synthesize their own amino acids) Cons • The exact mass shift is unpredictable because the number of replaced nitrogen atoms can very from peptide to peptide
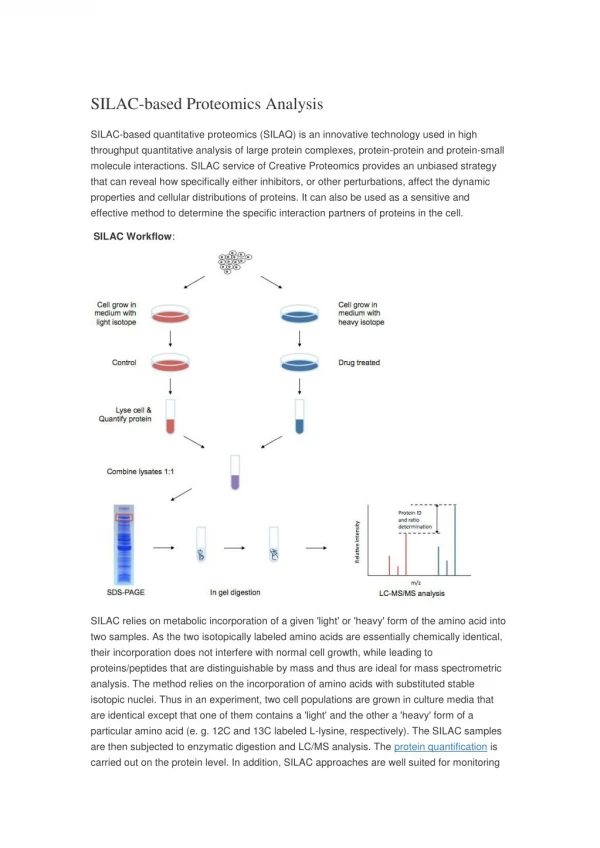
SILAC SILAC – This technique relies on the incorporation of isotopically labeled amino acids into proteins formed by the growing organism. Isotopically labeled amino acids such as lysine and arginine are added to the growth medium. Pros • Unlike 15N, SILAC allows for more comparisons within a single experiment due to the availability of several labels. • SILAC also has the advantage of predictable mass shift Cons • SILAC cannot be used on cell types that are unable to incorporate certain amino acids • Some cells are harder to grow in the environment required for SILAC due to the loss of essential growth factors
Enzymatic labeling (18O) 18Ois an enzymatic labeling technique where proteolytic labeling and stable isotope incorporation occurs simultaneously during digestion • Labeled and unlabeled samples are combined post digestion, so protein losses that occur during sample preparation would not be compensated for and would affect experiment reproducibility
Glossary • Proteome – The proteome is the entire set of proteins expressed by a genome, cell, tissue or organism. More specifically, it is the set of expressed proteins in a given type of cells or an organism at a given time under defined conditions. • Protein molecules sometimes have non-peptide groups attached which are prosthetic groups or co-factors • A chromatogram is the visual output of the chromatograph. In the case of an optimal separation, different peaks or patterns on the chromatogram correspond to different components of the separated mixture. • Chromatography is the collective term for a set of laboratory techniques for the separation of mixtures. • 15N – non radioactive isotope of Nitrogen