Download

1 / 43
510 likes | 1.05k Vues
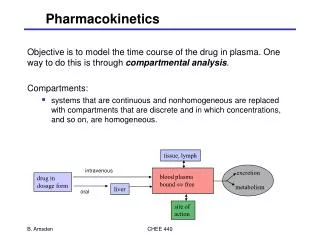
Principles of Pharmacokinetics Pharmacokinetics of Oral Administration, 1-Compartment. Karunya Kandimalla, Ph.D. Assistant Professor, Pharmaceutics Karunya.kandimalla@famu.edu. Objectives. Be able to: Describe 1-compartment pharmacokinetic models with first order absorption/elimination

E N D
Principles of PharmacokineticsPharmacokinetics of Oral Administration, 1-Compartment Karunya Kandimalla, Ph.D. Assistant Professor, Pharmaceutics Karunya.kandimalla@famu.edu
Objectives • Be able to: • Describe 1-compartment pharmacokinetic models with first order absorption/elimination • Define and calculate absorption & elimination rate constants, volume of distribution, area under the curve and bioavailability from concentration-time data • Understand influence of all these parameters on plasma concentration versus time curves • Recognize and use working equations for 1-compartment models
Recommended Readings • Chapter 7, p. 161-71, p. 176 • Pharmacokinetics of drug absorption • Zero order absorption model • First order absorption model • Absorption rate constants • Skip: • Wagner-Nelson method (p. 171-73) • Estimation of ka from urinary data (p. 174-75) • Two-compartment determination of ka
Intravascular vs. Extravascular (Oral) Administration • IV administration (bolus or infusion): • Drugs are injected directly into central compartment (plasma, highly perfused organs, extracellular water) • No passage across membranes • Population or individual elimination rate constants (kel) and volumes of distribution (Vd) enable us to calculate doses or infusion rates that produce target (desired) concentrations
Intravascular vs. Extravascular (Oral) Administration • Oral administration: • Drug not placed in central compartment but absorbed through at least 1 membrane • Significant inter- and intra-patient variability in rate + extent of absorption • Stomach emptying rate • Surface area of GI tract/blood flow • Peristaltic rate (intestinal motility) • First pass extraction (metabolism by liver) • Food, disease (e.g., diarrhea), other factors • Typically follows 1st order kinetics
Extravascular (Oral) Administration • Schematically, the simplest model can be represented as: Where Xa is the amount of drug to be absorbed, Xp is the amount of drug in the body, Vd is the volume in which the drug distributes, ka is the first order absorption rate constant, and kel is the first order elimination rate constant Drug Eliminated kel ka Drug in Body Drug in GI Tract Xa Xp = Vd • Cp
Orders of Reaction: Quick Review Zero Order Drug Elimination First Order Drug Elimination Ln Cp vs. t: Slope = -k Cp Cp Slope = -k Time Time Think of zero order processes as “saturated” (e.g., ethanol metabolism) or “limited” (e.g., controlled release) processes • Keeping the math straight: • When Cp plotted on semilog paper, slope = -k/2.303 • Log Cp vs time: slope = -k/2.303
The One-Compartment Extravascular Administration Model, Single Dose • Absorption phase: • dXa/dt > dXel/dt • Peak concentration: • dXa/dt = dXel/dt • Elimination phase: • dXa/dt < dXel/dt Absorption phase Elimination phase t1 t2 t3 Plasma level-time curve for a single oral dose, first order (concentration-dependent) kinetics
First Order Absorption/Elimination • At any time t, plasma concentration is a function of “rate in” minus “rate out” • dXp/dt = dXa/dt – dXel/dt • General integrated equation for calculation of drug concentration in plasma at time t is: Here ka must be greater than kel Difference between 2 exponential terms Hybrid Constant
Influence of Variations in Relative Rates of Absorption and Elimination on Plasma Concentration, Single Oral Dose ka/kel=10 ka decreases, kel increases ka/kel=1 ka/kel=0.1* Plasma concentration ka/kel=0.01* *Note: Flip-flop modelling applies
First Order Input & Elimination: Flip-Flop of ka and kel • When kel > ka, slope of terminal elimination phase is governed by ka • Slope = -ka/2.303 (semilog paper, log [C] vs t) • General integrated [C] equation becomes: Difference between 2 exponential terms Hybrid Constant
Drugs Products with Flip-Flop Characteristics • Fast elimination (kel > ka) • kel typically >> 0.69 hr -1 • ka typically << 1.38 hr -1 • Not often suitable for oral drug products • Extended release drug products • Most marketed drugs have elimination half-lives that are longer than their absorption half-lives, i.e., their kel < ka
Flip-Flop of ka and kel: Deciphering Atypical Drug Absorption • Requires an IV bolus study • After injection, decline in plasma level represents true elimination rate • Calculate IV kel and compare with kel from oral profile (terminal phase of ln Cp vs time) • If mismatch, assume a case of flip flop kinetics
2, high ka: Slope of terminal phase is parallel to i.v.’s and represents a true rate of drug elimination (controlled by Vd and clearance) 3, low ka: Slope of terminal phase not parallel to i.v.’s, reflecting rate limiting absorption Deciphering Atypical Absorption Journal of Veterinary Pharmacology & Therapeutics 2004;27(6):427-39
The Bi-Exponential First Order Plot • Cp can be plotted as a function of the difference between the two exponential curves • If we plot each exponential separately…
Plasma-Concentration Time Curve • A function of difference between ka and kel Cmax Cpt = ka • F• Dose • (e –kel • t – e –ka • t) Vd (ka – kel)
Plasma-Concentration Time Curve • Using log or natural log of [C] data “linearizes” the first order plot A Slope = ln Cp1 – ln Cp2 = -kel t1 - t2 lnCpt = A – kel • t (Postabsorption) T1/2 = 22 hr Absorption Time
“Archaic” Determination of kel • Sample plasma drug concentration at multiple times • Plot concentrations vs. time on semilog paper, with concentrations on y axis • Draw straight line through 3 points along terminal elimination phase • Avoid points close to Cmax • Calculate slope (“rise over run”) and solve for kel: • Slope = C1 – C3 = -kel/2.303 • t1 – t3
Determination of ka—Method of “Residuals” • Read any 3 points (x’1, x’2, x’3) on upper part of back-extrapolated elimination line • Drop essentially vertically and read 3 corresponding points on concentration-time curve (x1, x2, x3) • You should be in the absorptive phase • Calculate difference between extrapolated concentrations (e.g., x’1, x’2) and measured concentrations (e.g., x1, x2) • Plot differences at corresponding time points
Determination of Ka: Application of Method of Residuals ka • F• Dose = A Vd(ka – kel) • • • • • • Slope = -kel/2.3 = -0.064 Slope = -ka/2.3 = -0.254 (Residual Line)
Relevance of Absorption Rate Constants • Useful in designing multiple dose regimen • Prediction of tmax (time to Cmax) • Prediction of peak plasma [C] (Cmax) • Prediction of trough plasma [C] (Cmin) • Useful in bioequivalence studies • Pharmaceutical equivalents must demonstrate nearly identical rates of absorption • AUC (area under the curve), Cmax, and tmax must be the same within statistical limits
Jantoven-Coumadin Bioequivalency(5-mg Dose) • Question: • Do similar AUC and Cmax imply a similar tmax? • Check for yourself at http://www.cop.ufl.edu/cgi-bin/hh2.exe http://www.jantoven.com/hcp/bioequiv.html
Notes on Volume of Distribution • Definition:Size of a compartment necessary to account for total amount of drug at the concentration found in plasma • Different tissues may contain different drug concentration (differing binding affinities) • Anatomically speaking, does not have true physiological meaning • Represents result of dynamic drug distribution • May be <, =, or > than body volume
Volume of Distribution—The Concept Plasma [C] Tissue [C] “Apparent” Vd • • • • • • • • • • • • • • • • • • • • • • • • • • • • • • • • • • • • NB: For lipid-soluble drugs, Vd changes with body size and age (decreased lean body mass, increased fat)
Quiz Yourself: Volume of Distribution • In general, if a drug is confined in vascular region (i.e., it is highly bound to plasma protein), volume of distribution is _________ . • On the other hand, if it distributes into tissues extensively, Vd becomes ____________. • Why would certain drugs have different Vds?
1 compartment, y intercept method (requires IV study to determine F): Model-independent method (works regardless of model fitting drug’s kinetics) Calculation of Vd From Oral Absorption Data
Calculation of AUC (Model-Independent • Calculated by linear trapezoidal rule and extrapolation to infinity • Units = [C] • time
Defined as fraction of orally-administered drug that reaches systemic circulation Also expressed in relative terms (e.g., bioavailability of a generic relative to a brand Oral Bioavailability (F) May be affected by hepatic enzyme induction or inhibition (increased or decreased 1st pass metabolism or change in formulation excipients
We can calculate plasma concentration at anytime if we know values of all parameters: Cp can then be calculated from the following equations: Calculation of Cp at Anytime
We can also calculate the time of peak concentration if we know ka and kel: We can calculate maximal plasma concentration if we know kel: Note: Direct measurement of Cmax is difficult, so calculation is necessary Calculation of Cmax and tmax
Knowledge in Action—Understanding the Effects of Dose, F, ka, kel and Vd on Cp • Investigate the effect of changing • The Dose • Bioavailability (F) • Absorption rate constant (ka) • Elimination rate constant (kel) • Apparent volume of distribution (V) ….on Cmax and AUC… How would doubling the dose affect the Cp curve?
Influence of Dose on Plasma Levels Everything else held constant, doubling the dose doubles Cmax and the AUC http://www.cop.ufl.edu/cgi-bin/hh2.exe
How would a reduction in F from 1 to 0.5 affect the Cp curve?
Influence of Bioavailability on Plasma Levels Everything else held constant, diminishing F will diminish Cmax and the AUC http://www.cop.ufl.edu/cgi-bin/hh2.exe
How would a reduction in ka from 1 to 0.1 affect the Cp curve? What happens if ka becomes smaller than kel?
Influence of Absorption Rate on Plasma Levels Everything else held constant, diminishing ka will increase Tmax and diminish Cmax (as in slow-release preparations)
How would an increase in Vd from 100 to 150 liters affect the Cp curve?
Influence of Vd on Plasma Levels Everything else held constant, increasing Vd will increase Tmax, diminish Cmax and ke and increase half-life
Bonus Question Which of all the parameters reviewed affect the area under the curve?