Download
1 / 13
130 likes | 259 Vues
Observing the Diurnal Variability of Aerosol Optical Depth (AOD) from a Geostationary Satellite: Implications for Air Quality and Climate Monitoring. S. Kondragunta and I. Laszlo, NOAA/NESDIS/STAR P. Ciren and C. XU, Dell Inc. H. Zhang, UMBC J. Zeng and X. Zhang, ERT

E N D
Observing the Diurnal Variability of Aerosol Optical Depth (AOD) from a Geostationary Satellite: Implications for Air Quality and Climate Monitoring S. Kondragunta and I. Laszlo, NOAA/NESDIS/STAR P. Ciren and C. XU, Dell Inc. H. Zhang, UMBC J. Zeng and X. Zhang, ERT With acknowledgements to NASA AERONET/DRAGON team (PI: Brent Holben) Goldscmidt 2011 Conference August 14-20, 2011
Objective • To use GOES and AERONET AOD data to assess if frequent temporal sampling has implications for air quality and climate monitoring by: • analyzing spatial and temporal variability in AOD/surface pollution from a geostationary satellite • a case study of an exceptional event involving smoke from a fire GOES AOD Image superimposed with EPA ground observations of surface PM2.5
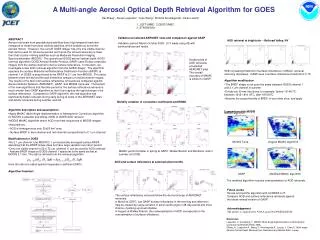
GOES AOD Product • Product generated from operational weather satellites. • One visible channel used to derive both surface reflectance and AOD. • Data available over CONUS every 30 minutes at 4 km resolution (nadir). • Data comparable to MODIS (see Prados et al., JGR, 2007) but less accurate over arid regions and in winter months. Geostationary Orbit: Strength 2015 UTC 2045 UTC 2115 UTC More spatial coverage in a day as clouds come and go
GOES AOD Product • Product generated from operational weather satellites. • One visible channel used to derive both surface reflectance and AOD. • Data available over CONUS every 30 minutes at 4 km resolution (nadir). • Data comparable to MODIS (see Prados et al., JGR, 2007) but less accurate over arid regions and in winter months. Geostationary Orbit: Weakness GOES-West 1415 UTC GOES-East 1415 UTC Accuracy dependent on the position of the Sun and the satellite
GOES and AERONET DRAGON Network AOD during DISCOVER-AQ Mean AERONET AOD (June-July 2011) GOES vs. AERONET (Correlation) 0.70 to 0.88 0.2 – 0.3 >0.3 Mean GOES AOD (June-July 2011) GOES vs. AERONET (Bias) 0.2 – 0.3 >0.3
GOES and AERONET AOD during DISCOVER-AQ for DRAGON network Time Series Summary: GOES reproduces the diurnal variability of AOD as observed by AERONET for the DISCOVER-AQ domain and time period, Station to station correlation (data not shown) very high indicating local pollution sources contributed less to observed AOD and that pollution was regional in scale, GOES AOD data can be applied for specific cases that have relevance to air quality policy (next few slides show a case study)
GOES Smoke Concentration Product Animation of Smoke Plume Detection • Semi-quantitative retrieval of column average smoke concentration (µg/m3) using AOD and fire hot spots from GOES • Uses source apportionment and pattern recognition techniques to isolate smoke aerosols from other type of aerosols • Smoke mass concentration (mc) is obtained using AOD (τ), mass extinction efficiency (k), and aerosol height (h) • Product used by NWS for operational smoke forecast verification Smoke AOD Image Original AOD Image FMS = 43% Rolph et al., Verification of NOAA Smoke Forecast: the 2007 Fire Season, Weather and Forecasting, 2009
Analysis of an Exceptional Event in Clinch County, GA A local fire at Arabia Bay in Clinch County, GA occurred in mid-November, 2010. Fire lead to smoke pollution (air quality violations) and reduced visibility in Voldosta area where PM2.5 standard was violated. Surface PM2.5 EPA, under “exceptional events rule” allows states to file a waiver for air quality standard violations. Observational data are excepted to be used to show evidence that non-anthropogenic sources (long-range transport of smoke/dust) are the cause for deteriorated air quality. Georgia is looking at this case and working with GOES AOD data.
Diurnal Variation of PM2.5 Emissions Observed by GOES • Fewer fires in Georgia • Fires did not always die down during the night • Smoke transport very localized • Agricultural burning • No night time fire activity • Significant amount of emissions • Smoke from these fires spread far and wide
Evolution of Smoke Aerosol on November 11, 2010 1515 1545 1615 1645 1715 1745 1815 1845 1915 2015 2145 2115 GOES Imagery MODIS Imagery
Aerosol Optical DepthEffect of diurnal sampling on monthly mean AOD • Monthly mean AOD from GOES AOD retrievals at 10:30 and 13:30 LST (“polar”) • lot of gaps • large areas with extreme values • Monthly mean AOD from half-hourly GOES AOD retrievals (“geo”) for July 2008 • less gaps • smoother AOD field • Regional errors in monthly mean AOD from “polar” is as large +/- 0.3 or higher • AERONET data shows similar pattern “polar” “geo” polar-geo difference
Aerosol Optical DepthNumber of retrievals • Determined by cloudiness, surface brightness and sampling frequency • Number of AOD retrievals varies regionally • pattern for “polar” and “geo” is different • “polar” under-sampled the east coast “polar” “geo”
Conclusions • GOES AOD product currently is in use for various air quality applications due to high temporal sampling. • Using in situ AOD data collected during DISCOVER-AQ time period, we showed that GOES captures the spatial and temporal variability well and can be used for “exceptional event analysis” and “SIP modeling”. • Analysis showed that diurnal sampling is critical for monthly mean calculations and may have implications for climate monitoring. • Analysis shown here supports the need for NASA’s GEO-CAPE mission.