Download
1 / 60
600 likes | 783 Vues
Organ and Tissue Donation – 2013 and Beyond. Teresa Shafer, RN, MSN, CPTC Executive Vice President and Chief Operating Officer. Presentation Overview. Sketch of Types of Donation – Frame up our System Controversial Metrics Donor Potential Questions. Organ Donation System and Process.

E N D
Organ and Tissue Donation – 2013 and Beyond Teresa Shafer, RN, MSN, CPTC Executive Vice President and Chief Operating Officer
Presentation Overview • Sketch of Types of Donation – Frame up our System • Controversial Metrics • Donor Potential • Questions
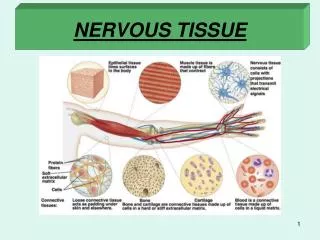
Currently… • Types of donation • Organ – Heart, Lung, Liver, Pancreas, Kidney, Intestine • Tissue – Bone, Ligaments, Tendons, Saphenous Veins, Heart Valves, Skin • Corneas/Eyes • Types of donors • Brain-dead, heart-beating • Non-heart-beating (Donation after Cardiac Death, DCD) • Living, related or unrelated
BRAIN DEATH Patient maintained on ventilator, heart beating Potential organ & tissue donor Tissue recovery follows organ donation DCD Family initiates withdrawal of care Patient likely to arrest within 60 minutes of extubation CARDIAC DEATH Patient has no cardiac or respiratory activity. Potential tissue donor Body must be kept cool before tissues are recovered. Recovery is within 24 hours of death Pathways to Donation
Currently… • Roughly 28,500 organs transplanted yearly in U.S. (22,000 from deceased donors, 6,500 from living donors) • Approximately 750,000 tissues transplanted yearly in U.S. • Approximately 45,000 corneas transplanted yearly in U.S.
Major Challenges • Limited supply of brain dead organ donors (estimated 12,000 nationally per year) • Demand for transplants growing faster than supply of organs • Early deceleration of care, DNI, DNR, improved trauma care, etc shrinking number of potential brain dead organ donors • Aging population means more “extended criteria” organs
National Health Crisis ORGAN SHORTAGE! Waiting List Living Donors Deceased Donors
Overall donation rates (per 100 eligible deaths), by DSA CY 2011 HRSA SRTR. http://srtr.transplant.hrsa.gov/annual_reports/2011/ The SRTR is administered by the Chronic Disease Research Group of the Minneapolis Medical Research Foundation, with oversight and funding from the Health Resources and Services Administration.
Organs transplanted per donor (OTPD), by DSA CY 2011 HRSA SRTR. http://srtr.transplant.hrsa.gov/annual_reports/2011/ The SRTR is administered by the Chronic Disease Research Group of the Minneapolis Medical Research Foundation, with oversight and funding from the Health Resources and Services Administration.
Variation in Waiting Time (months)for Deceased Transplant, 2011
Every Organ Every Time…….Where is the Case for OPO Volume?And what happens to OTPD, if we do make that case? Teresa Shafer, RN, MSN, CPTC Executive Vice President and Chief Operating Officer
Single Organ Donors –a match for a single recipient…. • The decision as to whether or not to recover a single organ from a single donor should not be driven by its effect on OPO OTPD. • The decision as to whether or not to recover a single organ from a single donor should not be driven by financial consideration.
Organ Donors 2003-2011 24% increase in organ donors, 2003 – 2007 1% increase in organ donors from 2007 - 2010 DHHS. OPTN. Collaborative Scorecard. Data for Period: September 2009 – August 2010. https:www.healthcarecommunities.org
US Population 2003-2010 6% increase in population, 2003 – 2009 • http://www.census.gov/popest/states/NST-ann-est.html
Reported Eligible Donors 2003-2011 DHHS. OPTN. Collaborative Scorecard. Data for Period: September 2009 – August 2010. https:www.healthcarecommunities.org
Conversion Rate 2003-2011 DHHS. OPTN. Collaborative Scorecard. Data for Period: September 2009 – August 2010. https:www.healthcarecommunities.org
Donors per Million 2003-2010 25% increase in d.p.m., 2003 – 2010 Donor Data from: DHHS. OPTN. Collaborative Scorecard. Data for Period: September 2009 – August 2010. https:www.healthcarecommunities.org Population data from www.aopo.org. AOPO Documents>AOPO Monthly Profile Survey Data
Donors & donors per million 2003-2010 Donors per Million Organ Donors 24% increase in organ donors 25% increase in donors per million DHHS. OPTN. Collaborative Scorecard. Data for Period: September 2009 – August 2010. https:www.healthcarecommunities.org
Decreasing Eligibles and Increasing Conversion Rate ConversionRate Eligible Donors DHHS. OPTN. Collaborative Scorecard. Data for Period: September 2009 – August 2010. https:www.healthcarecommunities.org
Donors & Conversion Rate 2003-2011 Conversion Rate Organ Donors 25% increase in organ donors 52% increase in conversion rate DHHS. OPTN. Collaborative Scorecard. Data for Period: September 2009 – August 2010. https:www.healthcarecommunities.org
Decreasing OTPD with donor volume (measured in dpm) OTPD DHHS. OPTN. Collaborative Scorecard. Data for Period: September 2009 – August 2010. https:www.healthcarecommunities.org
Eligible Donors do not represent the donor pool • Conversion rate with reported eligibles as denominator are not reliable inter-OPO (between OPOs) performance comparison metric. • Conversion rate intra-OPO (within OPO) are useful to that OPO to observe current conversion rate against historical conversion rates, given that the OPO did not change its own definitions or measurement strategies. • Reported Eligibles do not represent the U.S. donor pool, but we behave as if they do…… • While there are other problems with the eligible definition, the first step in the wrong direction was excluding donors from the pool who were not officially pronounced dead…..
An Unsustainable Trend & a need for Renewed Focus This is the trend that is not sustainable,- for our patients or for our credibility…….. We can’t transplant conversion rate, we can only transplant organs, and sadly, a volume metric is missing from the CMS Outcome Measures. You get more of what you measure…….and there is no volume metric in the CMS outcome measures……. Conversion Rate Organ Donors 25% increase in organ donors 52% increase in conversion rate
Conversion Rate & PotentialJan – July, 2013 compared to 2012 Conversion Rate of 71.4% in 2013, compared to a conversion rate of 79% in 2012. Applying same conversion rate to 2013 potential would yield 17 donors – 16 more donors for 2013. Conversion Rate: 9.6% decrease Donor Potential: 11% decrease 79% 71.4%
AA Consent Rate; African American Donors No AA potential donors in 2012 January – June 2013
Hispanic Consent Rate;Hispanic Donors January – June 2013
Caucasian Consent Rate; Caucasian Donors January – June 2013
OPO Productivity – VOLUMETotal Organ Donors DTCP Monthly UNOS data reports; most recent time period for Collaborative Scorecard through April as of July, 2013
OPO Productivity – VOLUMETotal Organs Transplanted DTCP Monthly UNOS data reports; most recent time period for Collaborative Scorecard through April as of July, 2013
Percent of Donors - SCD DTCP Monthly UNOS data reports; most recent time period for Collaborative Scorecard through April as of July, 2013
Percent of Donors - DCD DTCP Monthly UNOS data reports; most recent time period for Collaborative Scorecard through April as of July, 2013
POTENTIAL – NON TRADITIONAL DONORS There is opportunity cost but there is great potential in recovering non-traditional donors. Everyone should have the opportunity to donate. Every withdrawal of life support and ventilatory support should be evaluated and given the opportunity to donate. Presumptive – presume death will occur in time frame suitable for donation. OPPORTUNITY COST
TOP 24 Hospitals 2009 - 2012 Of approximately 6000 acute care hospitals in US, 2265 had atleast one organ donor during this period. Based on OPTN Data as of May 24, 2013
TOP 21 Hospitals - DCD 2009 - 2012 DCD Donors Based on OPTN Data as of May 24, 2013
DCD Donors – LifeGift Hospitals2009 - 2012 Based on OPTN Data as of May 24, 2013
Top Pediatric Hospitals2009 - 2012 Pediatric Donors 575 Hospitals had atleast 1 Pediatric Donor in 2009 – 2012. These are the nation’s largest Pediatric Organ Donor Hospitals Based on OPTN Data as of May 24, 2013
Top Pediatric Hospitals - DCD 2009 - 2012 Based on OPTN Data as of May 24, 2013
OPTN Deceased Donor Potential Study:Background, Early Findings and Commentary