Download
1 / 4
40 likes | 131 Vues
Correlation between ELISA and mass spectrometry analysis of lysophosphatidic acid (LPA) in patient samples for rapid quantification of LPA. Mandi Murph1, Tamotsu Tanaka1, Jihai Pang2, Edward Felix2, James Thompson3 and Gordon Mills1

E N D
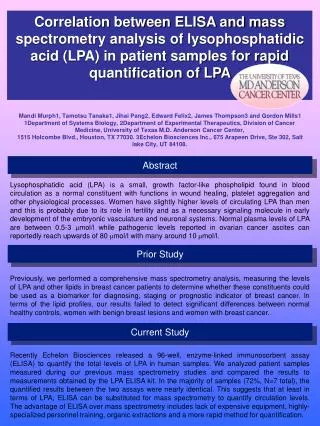
Correlation between ELISA and mass spectrometry analysis of lysophosphatidic acid (LPA) in patient samples for rapid quantification of LPA Mandi Murph1, Tamotsu Tanaka1, Jihai Pang2, Edward Felix2, James Thompson3 and Gordon Mills1 1Department of Systems Biology, 2Department of Experimental Therapeutics, Division of Cancer Medicine, University of Texas M.D. Anderson Cancer Center, 1515 Holcombe Blvd., Houston, TX 77030. 3Echelon Biosciences Inc., 675 Arapeen Drive, Ste 302, Salt lake City, UT 84108. Abstract Lysophosphatidic acid (LPA) is a small, growth factor-like phospholipid found in blood circulation as a normal constituent with functions in wound healing, platelet aggregation and other physiological processes. Women have slightly higher levels of circulating LPA than men and this is probably due to its role in fertility and as a necessary signaling molecule in early development of the embryonic vasculature and neuronal systems. Normal plasma levels of LPA are between 0.5-3 mol/l while pathogenic levels reported in ovarian cancer ascites can reportedly reach upwards of 80 mol/l with many around 10 mol/l. Previously, we performed a comprehensive mass spectrometry analysis, measuring the levels of LPA and other lipids in breast cancer patients to determine whether these constituents could be used as a biomarker for diagnosing, staging or prognostic indicator of breast cancer. In terms of the lipid profiles, our results failed to detect significant differences between normal healthy controls, women with benign breast lesions and women with breast cancer. Recently Echelon Biosciences released a 96-well, enzyme-linked immunosorbent assay (ELISA) to quantify the total levels of LPA in human samples. We analyzed patient samples measured during our previous mass spectrometry studies and compared the results to measurements obtained by the LPA ELISA kit. In the majority of samples (72%, N=7 total), the quantified results between the two assays were nearly identical. This suggests that at least in terms of LPA, ELISA can be substituted for mass spectrometry to quantify circulation levels. The advantage of ELISA over mass spectrometry includes lack of expensive equipment, highly-specialized personnel training, organic extractions and a more rapid method for quantification. Prior Study Current Study
A B Purpose of the current Study To compare the efficacy of detecting LPA concentrations using the new LPA ELISA kits from Echelon Biosciences to the results we previously obtained with the same patient plasma samples through mass spectrometry analysis. Prior Study Results Figure Descriptions A. Scatterplots of LPA lipids analyzed by LC/MS/MS. Plots show the comparison between lipids measured in cancer patients, women with benign tumors, and healthy controls. Results were not statistically significant. B. Average lysophospholipid concentration (nmol/0.5 ml plasma) in plasma of women with malignant and benign breast tumors and of healthy controls. C. LPA plasma measurements of specific patient samples obtained using variations of the ELISA kit and mass spectrometry to compare assays. D. Bar graph demonstrating the data plotted from (C).
4. Add Goat Anti-Mouse HRP and incubate. 1. Combine LPA standards and samples with labeled LPA antibody and incubate. (Initial incubation: users LPA sample + LPA antibody) (M) (M) 2. Incubate in detection plate, discard solution and wash. 3. Wash and discard unbound components. Concentration of LPA (M) 5. Add TMB substrate, incubate and read absorbance at 450 nm. 6. Conclusion: a higher signal indicates lower LPA concentrations. A lower signal indicates higher LPA concentrations. C D Methods for LPA ELISA Current Study Results
Results Undiluted plasma samples (a deviation from the current protocol) analyzed by ELISA were close to the actual concentrations previously obtained by mass spectrometry. Diluted samples yielded divergent values. Conclusion Our data suggests that at least for LPA, this ELISA kit can be substituted for mass spectrometry of patient plasma samples in order to quantify levels in circulation. This kit provides an easier, safer and less time-consuming method for LPA quantification. References Murph M, Tanaka T, Pang J, Felix E, Liu S, Trost R, Godwin AK, Newman R, Mills G. (2007) Liquid chromatography mass spectrometry for quantifying plasma lysophospholipids: potential biomarkers for cancer diagnosis. .Methods Enzymol;433:1-25. PMID: 17954226 Acknowledgements We would like to thank Echelon Biosciences, Inc. The research (“prior study”) was supported by a training fellowship from the Keck Center Pharmacoinformatics Training Program of the Gulf Coast Consortia, NIH Grant No.1 T90 070109-01 (to M.M.), the U.S. Department of Defense (grants DAMD17-02-1-0691 1 and DAMD17-03-1-0409 01), and the National Institutes of Health [NIH] (Ovarian Cancer PPG grant P01 CA64602, and AVON-NCI Ovarian SPORE grant P50 CA083639).