Understanding Real Functions: Graphs, Types, and Characteristics
This text provides an insightful overview of real functions, focusing on their variations and characteristics. It explores essential concepts such as zero variation, linear variations (both direct and partial), absolute value variations, and polynomial variations (quadratic and cubic). The discussion also highlights the significance of the rate of change, describing how to identify increasing, decreasing, and constant intervals in functions. Additionally, it delves into the domain and range of functions, alongside the concept of function positivity and negativity, essential for analyzing graphs in real-number contexts.

Understanding Real Functions: Graphs, Types, and Characteristics
E N D
Presentation Transcript
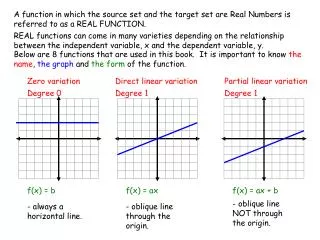
A function in which the source set and the target set are Real Numbers is referred to as a REAL FUNCTION. REAL functions can come in many varieties depending on the relationship between the independent variable, x and the dependent variable, y. Below are 8 functions that are used in this book. It is important to know the name, the graph and the form of the function. Zero variation Degree 0 Direct linear variation Degree 1 Partial linear variation Degree 1 f(x) = b f(x) = ax f(x) = ax + b - oblique line NOT through the origin. - always a horizontal line. - oblique line through the origin.
Absolute value variation Degree 1 Greatest-integer variation Degree 1 Inverse variation Degree 1 f(x) = k|ax + b| + c f(x) = k[ax + b] + c - V-shaped - series of steps with a closed point at one end and an open point at the other end of each step. - curved lines approaching both the x and y-axes
Quadratic variation Degree 2 Cubic variation Degree 3 f(x) = ax2 + bx + c f(x) = ax3 + bx2 + cx + d - U-shaped. - may have 2 vertices and may have 3 zeros
Rate of Change of a Function This is virtually the same as slope except that many functions are not straight lines and they do not have a constant slope. The word slope is not really appropriate in many functional situations. Rate of change is a calculation of how much a function has changed between 2 points whether it has been changing at an even rate, an increasing rate or a fluctuating rate. Therefore it can be applied to any function – not just straight lines. positive zero negative positive The rate of change can be positive, negative or zero and can be determined with the slope formula. Given 2 points, it should be possible to recognize whether the rate of change is positive, negative or zero at a glance.
INCREASE and DECREASE of a Function A function is said to be increasing if its rate of change is positive. The graph must be rising as it moves from left to right. As x increases, y increases A function is said to be decreasing if its rate of change is negative. The graph must be falling as it moves from left to right. As x increases, y decreases If a function is neither increasing nor decreasing, it is CONSTANT. It is not enough to determine whether a function is increasing or decreasing because sometimes functions may do both. It is necessary to be able to determine the interval of increase of a function and the interval of decrease. This interval refers the x-values for which the function is increasing or decreasing.
V (1,-4) V (1,-4) and increasing on the right side. This function is decreasing on the left side of the vertex To describe the interval for which this function is decreasing, we must describe the x-values for the decreasing portion of the graph. -∞,1] Notice that it is the x-value of the vertex that is used in describing the interval – not the y-value. To describe the interval for which this function is increasing, we must describe the x-values for the increasing portion of the graph. V (1,-4) V (1,-4) [1,∞ Notice that it is the x-value of the vertex that is used in describing the interval – not the y-value.
k(x) y x 1 x 1 x y g 1 x 1 Determine the increasing intervals, the decreasing intervals and the constant intervals for the following functions.
V (1,-4) DOMAIN and RANGE of a Function The domain of a function is the set of x-values from all of the ordered pairs of the function. For many real functions the domain is all real numbers. The range of a function is the set of y-values from all of the ordered pairs of the function. If we observe the quadratic function on the right, the graph opens to the left and right as it rises from the vertex. Thus the x-values to forever to the left and forever to the right, The domain is therefore: {x є R} V (1,-4) Upon observing the y-values for this function, there is a minimum y-value of -4 at the vertex. All other y-values are above this. We can therefore express the range as follows {y є R| y ≥ -4} OR [-4,∞
k(x) y x 1 x 1 x y g 1 x 1 Determine the domain and range for the following functions.
SIGN of a Function The sign of a function refers to whether a function is positive or negative. That is whether the y-values of the function are positive or negative. In most functions y is positive for part of it and negative for part of it. It is very easy to confuse the idea of the sign of a function with whether a function is increasing or decreasing but here is the difference. FUNCTION IS POSITIVE when Y is positive. FUNCTION IS INCREASING when RATE OF CHANGE is positive. FUNCTION IS NEGATIVE when Y is negative. FUNCTION IS DECREASING when RATE OF CHANGE is negative. A function changes from positive to negative at its zeros (x-intercepts). A function changes from increasing to decreasing at its vertex or vertices.
(-1,0) (-1,0) (-1,0) (3,0) (3,0) (3,0) The function on the right is positive above the x-axis and is negative below the x-axis. We can describe the positive portion of the function by describing the x-values for which the function is positive. -∞,-1] U [3,∞ We can describe the negative portion of the function by describing the x-values for which the function is negative. [-1, 3]
k(x) y x 1 x 1 x y 1 x 1 Determine the positive and negative intervals in the functions above.
k(x) y x 1 x 1 x y g 1 x 1 Determine the positive and negative intervals in the functions above.
maximum minimum minimum MAXIMUMS and MINIMUMS Maximums and minimums are vertices in functions. A quadratic function has 1 vertex which may be a maximum or a minimum depending on whether the parabola opens down or up. However, the cubic function can have 2 vertices – one maximum and one minimum. There is a difference however between the minimum of the quadratic function and the maximum and minimum of the cubic function. The minimum of the quadratic is the lowest y-value out of all of the y-values. It is called the absolute minimum. The maximum of the cubic function is the highest y-value of the points around it. There are higher in the function. Therefore the maximum is referred to as a relative maximum. The same is true for its minimum.
Absolute maximum Relative maximum Relative minimum Absolute minimum Relative Minimum: (-2,-4) Absolute Minimum: (4,-7) Relative Maximum: (1,-2) Absolute Maximum: (8,5)
k(x) y x 1 x 1 x y 1 x 1 Determine the maximums and minimums of the functions above. Indicate whether they are relative or absolute.
INTERCEPTS of a Function x-intercept - point where the function intersects the x-axis - also referred to as roots or zeros y-intercept - point where the function intersects the y-axis - if it exists there can only be one. x-intercepts: (-6,0), (-2,0) and (7,0) y-intercept: (0,2)
y = -x x = 1 x = -1 AXIS OF SYMMETRY Some functions have an axis of symmetry. This is a straight line that is NOT part of the function but can be drawn in such a way that one part of the function is the mirror image of the other part. For the quadratic function and the absolute value function there is an axis of symmetry that is a vertical line. For the inverse variation function there is an axis of symmetry that is an oblique line. For the function of the form below, the axis of symmetry is y = -x.