analyzer
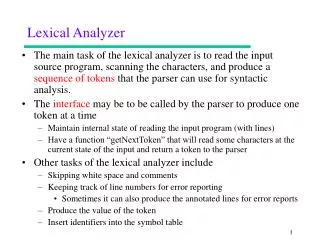
C. H. S. analyzer. Visual Documentation v1.0.4.1. User Interface. Active class (for selection and some processes). Number of wells associated with the active class (current plate only). Current activated plate. Process pipeline. Wells coordinate. Currently activated descriptor.

analyzer
E N D
Presentation Transcript
C H S analyzer Visual Documentation v1.0.4.1
Active class (for selection and some processes)
Number of wells associated with the active class(current plate only)
Current plate readouts display corresponding to the selected descriptor
Look up tablerelated to the current plate and the current descriptor
Available and activated descriptors When inactivated, the descriptors will not be taken into account for any process.
Zoom in and Zoom out(can also be performed with the mouse wheel)
When checkedclass selection is performed on all the currently activated plates
When pressed, all the wells will turned into the currently selected class (including non activated wells)
When pressed, the wells will turned into the currently selected class (only activated wells are concerned)
When the mouse cursor isplaced over a well, a list of information is displayed. This includes: Well position, name (if so), list of all the activated descriptors with their corresponding values and the class
Contextual menu: Histogram(right click on a well) Average and standarddeviation of the displayedhistogram Histogram of the selected histogram within the active class over the entire list of active plates.(The histogram color is related to the class) Current value of the selected well
Contextual menu: Info (right click over a well) Representation of the distribution (if available) of the current well selected descriptor Display (if loaded) Name, Information , Locus ID and Concentration associated to the current well (Info and Name are editable) Save new Info and Name
Contextual menu: Kegg (right click over a well)Locus ID is required for this option Current value of the selected well
Note: display distribution option requires the have loaded a distributions based screen
MS Excel view Notepad view The first row of the .csv data table should contain the name of every parameter. The order is not important has it can be change during the loading process. However, a column for the plate name, the well position and at least one descriptor (double format) are mandatory.
MS Excel view Notepad view Then, down below, the values are listed: double format for the descriptors and concentration, integer for the locus ID and class (<=10), and string for the others. If a descriptor value is missing or a parameter not formatted in the correct format, the well will be rejected from the screening.
A general directory containing every plate of the screening has to be created Every plate is defined by its own sub-directory. The name of the directory will be used as the plate name.
A general directory containing every plate of the screening has to be created Each plate directory should contain a .txt file for every well.The file name is defined as follow:“MxN.txt” Where M and N are respectively the column and row position (1 indexed)
MS Excel view For each well, every row describes a descriptor histogram: 1st column is the name, then the remaining columns contain the histogram values (tab-separated).Note: consistency between each .txt file is required. Importing such data can be operated trough the File->Load Histogram Based Screen menu.
Data type.Mandatory: Plate Name,well position and at leastone descriptor.Note: Locus ID should be defined as an integer.
If an effect X is selected, it will be combined to original data by the following way: Resulting Data = Original Data * (X +Shift_X)
The higher Shift_X is, the lower X contribution to the generated data
If a parameter X is checked, its value will vary from, increasing with a stepdefined in the options window.