
A673
Patel et al Supplemental Figure S5. A. B. A673. SK-N-MC. SK-ES-1. M. U. U. U. U. U. U. U. U. U. U. U. U. U. U. U. M. M. M. M. M. M. M. M. M. M. M. M. M. M. C. Sssi. EWS1. EWS2. EWS3. EWS4. EWS5. EWS6. EWS7. EWS8. EWS9. EWS10. EWS11. EWS12. EWS13.

A673
E N D
Presentation Transcript
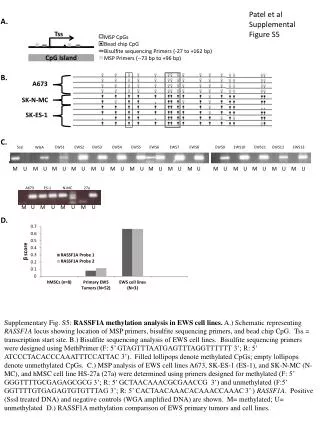
Patel et al Supplemental Figure S5 A. B. A673 SK-N-MC SK-ES-1 M U U U U U U U U U U U U U U U M M M M M M M M M M M M M M C. Sssi EWS1 EWS2 EWS3 EWS4 EWS5 EWS6 EWS7 EWS8 EWS9 EWS10 EWS11 EWS12 EWS13 WGA Tss MSP CpGs Bead chip CpG Bisulfite sequencing Primers (-27 to +162 bp) MSP Primers (--73 bp to +96 bp) A673 ES-1 N-MC 27a CpG Island M U M U M U M U D. Supplementary Fig. S5: RASSF1A methylation analysis in EWS cell lines. A.) Schematic representing RASSF1A locus showing location of MSP primers, bisulfite sequencing primers, and bead chip CpG. Tss = transcription start site. B.) Bisulfite sequencing analysis of EWS cell lines. Bisulfite sequencing primers were designed using MethPrimer (F: 5’ GTAGTTTAATGAGTTTAGGTTTTTT 3’; R: 5’ ATCCCTACACCCAAATTTCCATTAC 3’). Filled lollipops denote methylated CpGs; empty lollipops denote unmethylated CpGs. C.) MSP analysis of EWS cell lines A673, SK-ES-1 (ES-1), and SK-N-MC (N-MC), and hMSC cell line HS-27a (27a) were determined using primers designed for methylated (F: 5’ GGGTTTTGCGAGAGCGCG 3’; R: 5’ GCTAACAAACGCGAACCG 3’) and unmethylated (F:5’ GGTTTTGTGAGAGTGTGTTTAG 3’; R: 5’ CACTAACAAACACAAACCAAAC 3’ ) RASSF1A. Positive (SssI treated DNA) and negative controls (WGA amplified DNA) are shown. M= methylated; U= unmethylated D.) RASSF1A methylation comparison of EWS primary tumors and cell lines.