Download
1 / 1
10 likes | 122 Vues
2012 campaign.

E N D
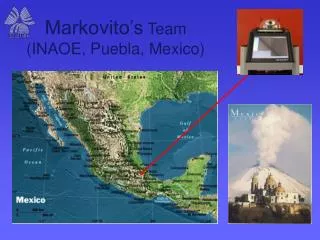
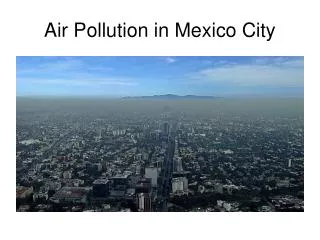
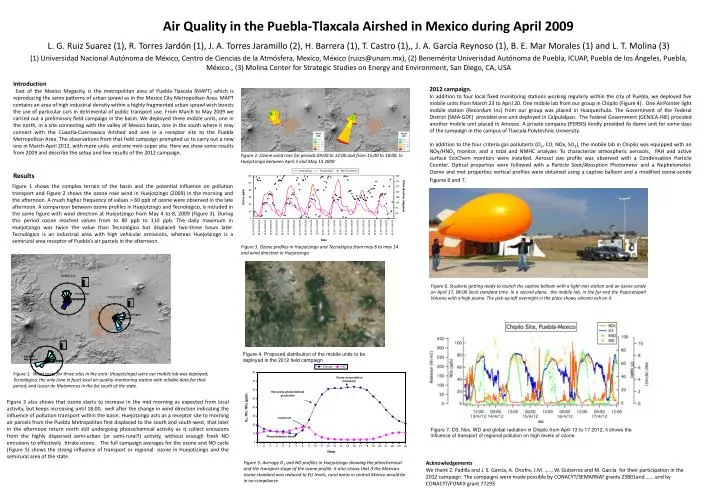
2012 campaign. In addition to four local fixed monitoring stations working regularly within the city of Puebla, we deployed five mobile units from March 23 to April 20. One mobile lab from our group in Chipilo (Figure 4). One AirPointer light mobile station (Recordum Inc) from our group was placed in Huaquechula. The Government of the Federal District (SMA-GDF) provided one unit deployed in Calpulalpan. The Federal Government (GENICA-INE) provided another mobile unit placed in Amozoc. A private company (PERSIS) kindly provided its demo unit for some days of the campaign in the campus of Tlaxcala Polytechnic University. In addition to the four criteria gas pollutants (O3, CO, NOx, SO2), the mobile lab in Chipilo was equipped with an NOy/HNO3 monitor, and a total and NMHC analyzer. To characterize atmospheric aerosols, PAH and active surface EcoChem monitors were installed. Aerosol size profile was observed with a Condensation Particle Counter. Optical properties were followed with a Particle Soot/Abosption Photometer and a Nephelometer. Ozone and met properties vertical profiles were obtained using a captive balloon and a modified ozone-sonde Figures 6 and 7. Introduction East of the Mexico Megacity, is the metropolitan area of Puebla-Tlaxcala (MAPT) which is reproducing the same patterns of urban sprawl as in the Mexico City Metropolitan Area. MAPT contains an area of high industrial density within a highly fragmented urban sprawl wich boosts the use of particular cars in detrimental of public transport use. From March to May 2009 we carried out a preliminary field campaign in the basin. We deployed three mobile units, one in the north, in a site connecting with the valley of Mexico basin, one in the south where it may connect with the Cuautla-Cuernavaca Airshed and one in a receptor site to the Puebla Metropolitan Area. The observations from that field campaign prompted us to carry out a new one in March-April 2012, with more units and one mini-super site.Here we show some results from 2009 and describe the setup and few results of the 2012 campaign. AirQuality in the Puebla-Tlaxcala Airshed in Mexico during April 2009 Figure 2. Ozone wind rose for periods 09:00 to 12:00 and from 15:00 to 18:00. In Huejotzingo between April 3 and May 14 2009 Figure 1 shows the complex terrain of the basin and the potential influence on pollution transport and Figure 2 shows the ozone rose wind in Huejotzingo (2009) in the morning and the afternoon. A much higher frequency of values > 60 ppb of ozone were observed in the late afternoon. A comparison between ozone profiles in Huejotzingo and Tecnológico, is included in the same figure with wind direction at Huejotzingo from May 4 to 8, 2009 (Figure 3). During this period ozone reached values from to 80 ppb to 110 ppb. The daily maximum in Huejotzingo was twice the value than Tecnológico but displaced two-three hours later. Tecnológico is an industrial area with high vehicular emissions, whereas Huejotzingo is a semirural area receptor of Puebla’s air parcels in the afternoon. Results Figure 3. Ozone profiles in Huejotzingo and Tecnológico from may 8 to may 14 and wind direction in Huejotzingo L. G. Ruiz Suarez (1), R. Torres Jardón (1), J. A. Torres Jaramillo (2), H. Barrera (1), T. Castro (1),, J. A. García Reynoso (1), B. E. Mar Morales (1) and L. T. Molina (3) (1) Universidad Nacional Autónoma de México, Centro de Ciencias de la Atmósfera, Mexico, México (ruizs@unam.mx), (2) Benemérita Univerisdad Autónoma de Puebla, ICUAP, Puebla de los Ángeles, Puebla, México., (3) Molina Center for Strategic Studies on Energy and Environment, San Diego, CA, USA Figure 6. Students getting ready to launch the captive balloon with a light met station and an ozone sonde on April 17, 08:00 local standard time. In a second plane, the mobile lab, in the far end the Popocatepetl Volcano with a high plume. The pick-up left overnight in the place shows volcano ash on it. Huejotzingo Tecnológico Figure 4. Proposed distribution of the mobile units to be deployed in the 2012 field campaign Izucar de Matamoros Figure 1. Wind roses for three sites in the area: (Huejotzingo) were our mobile lab was deployed; Tecnológico, the only (one in four) local air quality-monitoring station with reliable data for that period, and Izucar de Matamoros in the far south of the state. Figure 3 also shows that ozone starts to increase in the mid morning as expected from local activity, but keeps increasing until 18:00, well after the change in wind direction indicating the influence of pollution transport within the basin. Huejotzingo acts as a receptor site to morning air parcels from the Puebla Metropolitan first displaced to the south and south-west, that later in the afternoon return north still undergoing photochemical activity as it collect emissions from the highly dispersed semi-urban (or semi-rural?) activity, without enough fresh NO emissions to effectively titrate ozone. The full campaign averages for the ozone and NO cycle (Figure 5) shows the strong influence of transport or regional ozone in Huejotizingo and the semirural area of the state. Figure 7. O3, Nox, WD and global radiation in Chipilo from April 13 to 17 2012, it shows the influence of transport of regional pollution on high levels of ozone Figure 5. Average O3 and NO profiles in Huejotzingo showing the phtochemical and the transport stage of the ozone profile. It also shows that if the Mexican ozone standard was reduced to EU levels, rural areas in central Mexico would be in no-compliance. Acknowledgements We thank Z. Padilla and J. S. García, A. Onofre, J.M. ….., W. Gutierrez and M. García for their participation in the 2012 campaign. The campaigns were made possible by CONACYT/SEMARNAT grants 23801and …… and by CONACYT/FOMIX grant 77293