Download
1 / 24
240 likes | 433 Vues
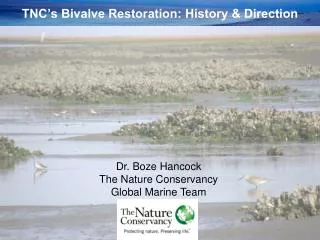
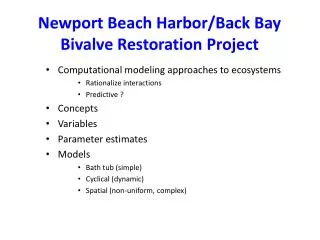
Newport Beach Harbor/Back Bay Bivalve Restoration Project. Computational modeling approaches to ecosystems Rationalize interactions Predictive ? Concepts Variables Parameter estimates Models Bath tub (simple) Cyclical (dynamic) Spatial (non-uniform, complex). Back Bay. Newport Harbor.

E N D
Newport Beach Harbor/Back BayBivalve Restoration Project • Computational modeling approaches to ecosystems • Rationalize interactions • Predictive ? • Concepts • Variables • Parameter estimates • Models • Bath tub (simple) • Cyclical (dynamic) • Spatial (non-uniform, complex)
Back Bay Newport Harbor
Back Bay Newport Harbor
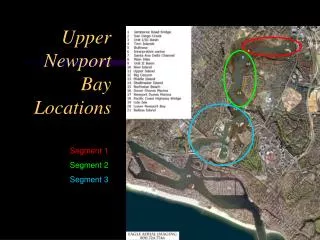
Newport Beach Harbor Harbor Shoreline = 16 km Area = 62471 pix2 =3,500,000 m2 = 1870 x 1870 m Average depth = 4 m (13ft) (range 2.5 m (8ft) to 6 m (20ft) Volume = 14,000,000 m3 (8,700,000 m3 – 21,000,000 m3) Upper Newport Bay Low tide channels = 18407 pix2= 1,000,000 m2 = 1015 x 1015 m Average depth = 2.5 m Volume = 2,500,000 m3 High tide area = +10340 pix2= 579,040 m2 = 761 x 761 m Average depth = 0.5 m Volume = 290,000 m3 Flood plain = +32798 pix2 = 1,800,000 m2 = 1355 x 1355 m Average depth = 0.5 m Volume = 900,000 m3
Tidal Flow Area = 62471 pix2 =3,500,000 m2 = 1870 x 1870 m Average depth = 4 m (13ft) (range 2.5 m (8ft) to 6 m (20ft) Volume = 14,000,000 m3 (8,700,000 m3 – 21,000,000 m3) Tidal range ± 1.3 m Volume = 4,500,000 m3 Harbor Entrance = 220 m Depth = 6 m (20 ft) Cross-sectional area = 1320 m2 Tidal cycle (high tide-low tide) ~ 6 hrs or 360 mins Flow rate (m3/min) at entrance = 12,600 m3/min Surface speed = 10 m/min (or 0.600 km/hr)
Bivalve Statistics Typical oyster filtration rate = 22 - 100 L/day = 0.92 – 4.2 L/hr = 15 – 70 mL/min Average size of oyster bivalve = 5 cm No of of bivalves/m2 = 100 biv/m2 (range: 10 – 400 biv/m2) Filtration rate range @ 10 biv/m2= 150 mL/min – 7,00 mL/min @ 100 biv/m2 =1,500 mL/min – 7,000 mL/min @ 400 biv/m2 = 6,000 mL/min – 28,000 mL/min Filtration rate per tide @ 10 biv/m2= 0.15 L/min x 360 min = 54 L – 252 L @ 100 biv/m2 = 540 L – 2520 L @ 400 biv/m2 = 2160 L – 10,080 L Filtration rate per tide @ 10 biv/m2 = 0.054 m3 – 0.252 m3 @ 100 biv/m2 = 0.540 m3 – 2.520 m3 @ 400 biv/m2 = 2.160 m3 – 10.080 m3
% of Newport Harbor Water Filtered per tide Area = 62471 pix2 =3,500,000 m2 = 1870 x 1870 m Tidal range ± 1.3 m Volume = 4,500,000 m3 Total Number of Bivalves in bay @ 10 biv/m2 = 35,000,000 @ 100 biv/m2 = 350,000,000 @ 400 biv/m2 = 1,400,000,000 Filtration rate per tide @ 10 biv/m2 = 0.054 m3 – 0.252 m3 @ 100 biv/m2 = 0.540 m3 – 2.520 m3 @ 400 biv/m2 = 2.160 m3 – 10.080 m3 Volume filtered per tide @ 10 biv/m2 = 0.0540 x 3,500,000 = 190,000 m3 to 880,000 m3 (4 – 20 %) @ 100 biv/m2 = 1,900,000 m3 to 8,800,000 m3 (40 - 200 %) @ 400 biv/m2 = 7,500,000 m3 to 29,000,000 m3 (166 – 640 %)
Spatial Gradients of Variable Factors • Nutrient distribution • Bivalve habitat San Diego Creek and Springs flowin = m3/min [Nutrient] = #/m3 Newport Harbor Entrance flowout = m3/min bivalve density (#/m2)
Bivalve habitat (2D #/m2)
Spatial Gradients of Factors • Tidal changes in volume (Dm3) & surface area (Dm2) • Relevance to habitat (#/m2) San Diego Creek Newport Harbor Entrance
Cyclical Changes San Diego Creek tidal flow = ± m3/min growth = D#/min Newport Harbor Entrance turbidity = #/m3 filtration = m3/min
Stochastic Events • Weather • Surge run-off San Diego Creek Newport Harbor Entrance
To simplify let’s make some assumptions …. • Conservation of components (in = out) • Well mixed system • Volume and surface area = constant • 1 principal factor determines phytoplankton growth bivalve population San Diego Creek Input = [In]xFlowin = #/m3 xm3/min i.e. #/min Newport Harbor Entrance Output = [Bay] xFlowout = #/m3 xm3/min i.e. #/min
Bivalve Ecosystem Sunlight Fresh water flow • Nutrients (N, P, Fe) turbidity % dieoff PP carrying capacity (max population size) salinity Phytoplankton Biv carrying capacity (max population size) turbidity Salt water (tidal) food chain Bivalves % dieoff toxicity Pollutants
Population Growth • Exponential growth • xt = xo(1+r)t or P(t) = Po(1+ growth rate)time interval • Solving over time (dx/dt) for changes in population size …. x = aektorP(t) = Pini . e(growthconstant.time) Population grows rapidly for k>0
Logistic growth (Verhulst-Pearl equation) • Initial stage of growth is approximately exponential; then, as saturation begins, growth slows, and, at maturity, net growth stops • P(t) = 1/(1+e-t) • Solving over time …. dP(t)/dt = P(t) . (1-P(t)) • For biological systems where rate of reproduction is proportional to both the existing population and the amount of available resources self-limiting growth of population • dP/dt = rP(1-P/K) where r = growth rate and K is the carrying capacity • note early exponential growth depends on +rP; later, competition for food/space etc. is due to larger term –rP2/K carrying capacity (K) resource limits (feedback) P(t) = (K.Po.ert)/(K+Po(ert-1)) where limP(t) = K t→∞ Exponential growth (r = frac. change/time)
What is limiting for phytoplankton (PP) growth ? • Nutrient sources (N, P, Fe) or sunlight • Are these constant, variable or variable + periodic (seasonal) • Will these variables change the growth rate (r), carrying capacity (K) or both ? • How is increasing [PP] related to turbidity reduces sunlight reduces growth ? Nutrient Level Change in Bay d(V.Cbay(t))/dt= Cin.Q – Cbay(t).Q – KconsP(t).V ⇒ dCbay(t)/dt = Q/V(Cin-Cbay(t)) – kcons.P(t) ……. Eq. 1 where …. C = nutrient conc. (moles/m3); Q = flow rate (m3/min) Kcons = consumption rate (moles of nutrients/moles of PP.min)
Phytoplankton Growth Growth of Phytoplankton dP(t)/dt = kgrowthCbay(t)P(t)(1-P(t)/Pmax) – kdeg(V/min)Pbiv…. Eq. 2 kgrowthCbay(t) is growth rate term (r) Pmax is PP carrying capacity (K) – kdeg(V/min)Pbivis clearance rate of PP by bivalve population Turbidity Turb(t) = kopt.P(t) ….. Eq. 3 • Turb(t) is interdependent with self-limiting growth from equation 2 • and efficiency/size of bivalve population (clearance rate) • kopt is a conversion constant
Bivalve Population Growth Can write similar equations for bivalve population changes….. • Dependent on [PP] (measured as ∞ turbidity) • Bivalve Kbiv (carrying capacity) is dependent on [PP] and time-varying variables (e.g. seasons) • Bivalve growth rate (rbiv) is dependent on filtration rate (efficiency) and [PP] (resource) What factors might affect efficiency ? • Habitat (spatial differences: tidal flats v. channels) • Pollution (impaired growth)