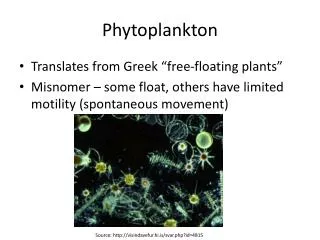
Phytoplankton and Primary Productivity
520 likes | 1.72k Vues
Phytoplankton and Primary Productivity. Introduction to Biological Oceanography 2004 Marlon Lewis. Primary Productivity: Background Readings. Kirk, J.T.O., 1994. Light and Photosynthesis in Aquatic Systems. Cambridge University Press. Chapter 8. Background only:

Phytoplankton and Primary Productivity
E N D
Presentation Transcript
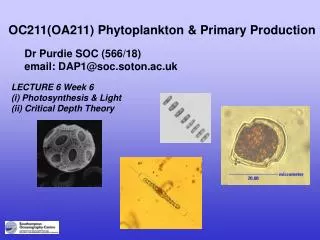
Phytoplankton and Primary Productivity Introduction to Biological Oceanography2004Marlon Lewis
Primary Productivity: Background Readings • Kirk, J.T.O., 1994. Light and Photosynthesis in Aquatic Systems. Cambridge University Press. Chapter 8. • Background only: • Geider, R.J. and H.L. MacIntyre 2002. Physiology and biochemistry of photosynthesis and algal carbon acquisition. (pp44-77). • Marra, J. 2002. Approaches to the measurement of plankton production. (78-108). • Both in: In, P.J. LeB. Williams, D.N.Thomas, and C.S. Reynolds (eds.) Phytoplankton Productivity: Carbon Assimilation in Marine and Freshwater Ecosystems. Blackwell.
Objectives: • At the conclusion of this lecture and associated reading, you should be able to: • Define and discuss photosynthetic primary production in the ocean, and its significance for biological processes. • Discuss the measures of phytoplankton biomass, and their general distribution in the world’s oceans (both horizontal and vertical). • Discuss the light and dark reactions of photosynthesis, and their relationship to carbon and oxygen dynamics. • Discuss various means for the measurement of primary production of the ocean. • Analyze quantitatively the relationship between primary production and irradiance. • Synthesize the above to estimate the rate of primary production on a local and global scale.
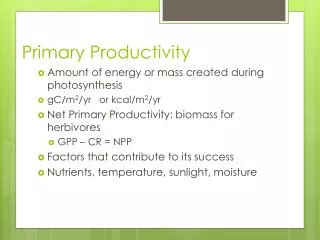
Recall: Primary production is the rate of synthesis of organic material from inorganic compounds such as CO2 and water. It is significant in that it provides the base of most of the entire marine food chain. The formation of organic carbon compounds from inorganic carbon (e.g. carbon dioxide) involves a reduction reaction; the reducing power (e.g. NADPH) comes from either the absorption of light (photosynthesis), or the oxidation of other compounds (chemosynthesis).It is a rate, hence involves dimensions of time:mg C m-3 s-1, or in a depth integrated sense, mg C m-2 s-1
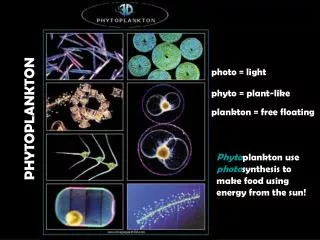
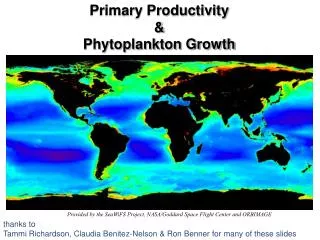
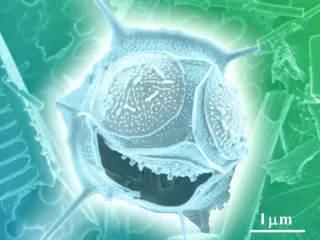
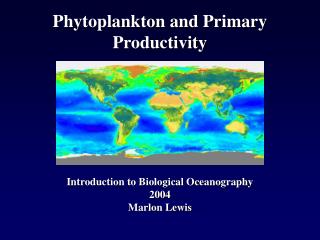
Phytoplankton are the principle agents responsible for photosynthetic primary production in the ocean. In coastal regions, benthic macro and micro algae, and submerged vascular plants all contribute. Typical rates: The rate of photosynthesis can be in terms of carbon reduced (e.g. mg or mol C per unit volume (or area) per unit time) or in terms of oxygen evolution (mol O2 per unit volume or area per unit time). Typical rates for the ocean are10-100 mg C m-3 d-1 (local); 75-1000 mg C m-2 d-1 (depth integrated). Clearly, it is highly variable; understanding the sources of this variability, and predicting photosynthetic rates is a major goal of biological oceanography. To first order, the rate of primary production is set by the concentration of phytoplankton – the photosynthetic biomass - in particular the concentration of carbon or chlorophyll a. Global distribution of chlorophyll:
Photosynthetic Biomass: Carbon Definition: The mass of carbon contained within living phytoplankton cells per unit volume or per unit area. How is it measured? With great difficulty – there is much other “particulate organic carbon” (POC) which is associated with non-photosynthetic organisms,and with detritus. NB: “Particulate” and “dissolved” are operational definitions and depend on the size of the filter used to discriminate. Small particles pass filters and can be included within the dissolved fraction. 1. Discrete water samples • Microscopy (count living cells under the microscope) • Flow cytometry (automated enumeration and sizing of fluorescent cells) Both methods require conversion factors for cell numbers to cell volume and cell volume to a mass of carbon Typical oceanic range (per unit volume): 10-60 mg C m-3 Typical oceanic range (per unit area): 1-2 g C m –2 This is a difficult approach, and apart from algal cultures, not often done routinely at sea. Instead, the much more easily measured chlorophyll a concentration is used.
Photosynthetic Biomass: Chlorophyll a Definition: The mass of chlorophyll a contained within living phytoplankton cells per unit volume or per unit area. How is it measured? 1. For discrete samples, seawater is filtered onto relevant filters (again, the “pore size” of the filters is extremely important; much historical work with nets and filters with large pore sizes missed most of the biomass, the so-called “picoplankton” – Prochlorococcus, Synechococcus, Ostreococcus). Filters are then “extracted” using organic solvents – acetone, methanol etc. This places chlorophyll (and other pigments) into solution. The concentration of chlorophyll is measured in the solvent – either as absorptance (spectrophotometric) or fluorescence of the fluid (chlorophyll absorbs blue light, and emits red), or separated out and measured by chromatographic methods, now primary High Performance Liquid Chromatography (HPLC). HPLC can also provide measures of other pigments. 2. The fluorescence of the unextracted raw seawater can also be used to estimate the concentration of chlorophyll, either on discrete samples, or from remote profiled or towed vehicles. It can also be estimated from the color of the sea. Typical oceanic range (per unit volume): 0.01-10 mg Chl a m-3 Typical oceanic range (per unit area): 10->100 mg Chl a m-2
Vertical Chlorophyll Distributions: Open Ocean Coastal Deep Chlorophyll Maximum Note difference in scale in both axes.
A Cycle of Life and Death Surface Ocean Light + Nutrients Growth Consumption Nutrients Decomposition Deep Sea Bottom
The Growth of Phytoplankton(surface layer of the ocean) Cell Division DaughterCell Photosynthesis Doubled Biomass Single Cell Daughter Cell Nutrient Uptake Result: • More suspended particulate organic matter (food) • Less dissolved inorganic nutrients (N, P, Si) • Less dissolved inorganic carbon (CO2)
The Growth of Phytoplankton(surface layer of the ocean) DaughterCell Fates: Accumulate (Bloom) Be eaten Sink Daughter Cell
Consumption and Decomposition(deep ocean) Microbial Decomposition Organic Matter Nutrients CO2 DEEP-SEA LIFE + Consumption Respiration Excretion Result: • Less suspended particulate organic matter • More dissolved inorganic nutrients (N, P, Si) • Supersaturated dissolved inorganic carbon (CO2)
Biological Pump Through a cycle of life and death, primary productivity drives food-webs and biogeochemical cycling in the sea
The growth rate of phytoplankton depends on light, nutrients and temperature – here we will examine the relationship between light and photosynthetic primary production of organic matter. Note that the rate of photosynthetic primary production is related to the growth rate through the concentration of phytoplankton carbon, that is, if we divide or “normalize” the rate of primary production by the concentration of carbon, we obtain the growth rate, with dimensions of inverse time. This allows us to examine variations in physiology independent of the actual biomass concentrations. Given the difficulty with measurement of phytoplankton carbon however, it is more usual to normalize by the concentration of chlorophyll, with resulting dimensions of mass C produced per mass chlorophyll per unit volume per unit time (e.g. mg C mg Chl-1 m-3 h-1).
Photosynthesis • Photosynthesis is the process by which absorbed light energy is used to “split” or oxidize water, and reduce inorganic carbon dioxide to organic carbon compounds. Oxygen is produced as a byproduct of this process. Requirements: • Available solar energy in the waveband 400-700 nm. • Pigments to absorb photons • Electron transport chains and biochemistry to produce ATP, reducing power (NADPH), and ultimately a variety of organic carbon compounds.
Photosynthesis Overview Consists of “Light Reactions” and “Dark Reactions”. Light Rx | Dark Rx Note that cyanophytes do not have chloroplasts.
Photosynthetically Available Radiation (PAR) A sufficient number of photons in the waveband 400-700 nm is required to effect a net production of organic carbon, or oxygen. (N.B. There are also catabolic reactions that consume organic carbon, and oxygen, e.g. respiration. The rate of gross photosynthetic production must be sufficient to overcome this, and when it does, positive net primary production results.) Open Ocean (Equator) Coastal Ocean (New Jersey)
Effects of Light on Photosynthesis Net Photosynthesis = Gross Photosynthesis - Respiration Note that the rate of photosynthesis here is “normalized” to unit concentration of chlorophyll a.
Compensation irradiance Light level at which respiration is equal to photosynthesis At this irradiance level, net primary production is zero. The depth at which the daily averaged compensation irradiance is realized sets the limit of the “euphotic zone”, where net primary production is positive.
The Role of Pigments The use of light energy to reduce carbon requires the presence of photosynthetic pigments which are responsible for the absorption of solar energy. Recall the absorption coefficient, a, the rate at which light energy is removed by absorption. Given a local scalar irradiance level, the removal of energy is given as where the integration is taken over the photosynthetic waveband 400-700 nm (W m-3 or mmol quanta m-3 s-1). Note that this includes all components that absorb light, including water, phytoplankton and CDOM. For photosynthesis, we are only interested in that absorbed by photosynthetic phytoplankon pigments.
0.7 Total 0.6 ) 0.5 Water -1 0.4 Absorption (m 0.3 Phytoplankton 0.2 Detritus + dissolved colored matter 0.1 0 400 450 500 550 600 650 700 Wavelength (nm) Absorption in the ocean
Absorption in the ocean (contd.) Here, the total absorption coefficient is partitioned into components due to water, to phytoplankton, and to detritus and CDOM. For the phytoplankton part, the coefficient a*ph is the “chlorophyll-specific absorption coefficient”. It represents the absorption by unit concentration of chlorophyll a (m-1 (mg Chl m-3)-1 or m2 mg Chl-1). In reality of course, it includes absorption by all of the active photosynthetic pigments, not just chlorophyll a. http://www.iopan.gda.pl/~kaczmar/pracownia/zsinica1.gif
Photosynthetic Pigments All photosynthetic organisms contain one or more organic pigments capable of absorbing visible radiation, which will initiate the photochemical reactions of photosynthesis. The three major classes of pigments are the chlorophylls, the carotenoids and the phycobilins. Carotenoids and phycobilins are called accessory pigments since the quanta (packets of light) absorbed by these pigments can be transferred to chlorophyll.
Photosynthetic Pigments: Chlorophylls Chlorophylls chlorophyll a - present in all higher plants and algae chlorophyll b - present in Chlorophytes chlorophyll c - present in Chromophytes (chlorophyll a is present in all photosynthetic organisms that evolve O2.) Chlorophyll molecules contain a porphyrin 'head' and a phytol 'tail'. The polar (water-soluble) head is made up of a tetrapyrrole ring and a magnesium ion complexed with the nitrogen atoms of the ring. The phytol tail extends into the lipid layer of the thylakoid membrane.
Photosynthetic Pigments: Carotenoids Carotenoids (carotenes and xanthophylls) Carotenes: Primarily a-carotene, -carotene – see Jeffrey and Vesk Xanthophylls: e.g. fucoxanthin, diadinoxanthin, peridiniin, zeaxanthin etc. etc. Carotenoids contain a conjugated double bond system of the polyene type (C-C=C-C=C). Energy absorbed by carotenoids may be transferred to chlorophyll a for photosynthesis; some forms are photoprotective, and photosynthetically incompetent.
Photosynthetic Pigments: Phycobiliproteins Phycobilins (found mostly in red algae, cyanophytes and cryptophytes ): phycoerythrin phycocyanin allophycocyanin These are linear tetrapyrroles structurally related to chlorophyll a but lack the phytol side chain and magnesium ion. They are water soluble, unlike chlorophylls and carotenoids. Phycobiliproteins absorb light in the blue-green region of the spectrum which reaches deep-sea depths. http://www.botany.hawaii.edu/faculty/webb/BOT201/BOT201/Algae/Bot%20201%20phycobilisome%20hemispherical%20Tsukuba.jpg
Light Reactions Photosynthetic pigments are organized as “photosystems” with “antenna” complexes. Energy absorbed by pigments in the antenna is transferred to “reaction centres” – specialized chlorophyll a molecules – where electrons are excited and either are taken up by the “primary electron acceptor” (engaged in photosynthesis) or fall back down and emit heat or fluorescence. Photophosphoralation (electron transport) ATP + NADPH ATP provides energy, NADPH the reducing power for the subsequent reduction of carbon dioxide
Dark Reactions The Calvin-Benson Cycle uses the products of the light reactions to fix carbon dioxide into organic carbon compounds. Proteins, Carbohydrates, Lipids
OK, OK, what happened to the ocean stuff…. • First, how is the rate of photosynthesis measured in the ocean? • Most common is the so-called 14C technique. • Collect water sample. • Add radioactive inorganic carbon as a tracer • Incubate under different light levels for some time (~ 1-24 hours) • Filter sample, or acidify to remove all inorganic carbon • Measure radioactivity of what is left – this is proportional to the rate of fixation of carbon or primary productivity. • Normalize to unit time and unit pigment concentration to express results (i.e. mol C (mg Chl)-1 h-1). • Next most common is the measurement of oxygen evolution/uptake. It is far less sensitive than the 14C method. • Collect water sample • Measure initial oxygen concentration • Incubate under different light levels (and dark) for some time. • Measure final oxygen concentration • Normalize to unit time and unit pigment concentration to express results (i.e.mol O2 (mg Chl)-1 h-1)
“In situ” incubation Simulated “In situ” incubation Photosynthetron: Controlled laboratory incubation (Lewis and Smith 1983)
Primary Production as a function of light (P vs E curves) 1. At low light, the rate of photosynthesis is proportional to the incident (absorbed) light. The P vs E curve is approximately linear with slope a. Photosynthesis (g C (g Chl)-1 h-1) a = a*phm Irradiance (PAR, umol m-2 s-1)
Primary Production as a function of light (P vs E curves) 2. At intermediate intensities, the P vs E curve flattens – light saturation occurs. Pmax Photosynthesis (g C (g Chl)-1 h-1) Ek a Irradiance (PAR, umol m-2 s-1)
Primary Production as a function of light (P vs E curves) 3. At very high intensities, the P vs E curve falls off – light inhibition occurs. High irradiance can damage the reaction centers and reduce the photosynthetic rate below its maximal value. Not clear how relevant this is in real ocean. Photoinhibition Photosynthesis (g C (g Chl)-1 h-1) Irradiance (PAR, umol m-2 s-1)
P vs E curve depends on photoacclimation -Results for a diatom grown in the lab show how the P-E relationship changes as a function of growth irradiance. (PEg = photosynthesis at growth irradiance). -When modeling the primary productivity in the ocean, one has to use a P vs E curve appropriate for the acclimation irradiance.
The P-E relationship depends on the time-scale of the measurement
6 B Surface 5 75 m 4 PB (g C g Chl-1 h-1) 25m 3 2 1 100 m a 0 0 500 1000 1500 2000 Irradiance (mmol m-2 s-1) 6 C 70 m P vs E curve and mixing In a stratified water column, the P vs E curve changes significantly with depth. In a well mixed layer, the P vs E curve is similar throughout the mixed layer. • Phytoplankton can adapt to both the intensity and spectral quality of light. • Phytoplankton at low light should be adapted to increase the probability of capture of photons of light.
P vs E curves in the ocean P vs E curves measured at different depths in the Sargasso Sea and Gulf Stream Photosynthesis (g C (g Chl)-1 h-1) Irradiance (PAR, umol m-2 s-1) How to choose the appropriate curve?
Predicting Photosynthesis in the Ocean • Important terms: • Phytoplankton biomass — B (mg Chl) • Incident solar radiation — E0(l) (mmol m-2 s-1 nm-1) • Photosynthesis vs. irradiance — P vs E relationship(s) • Penetration of solar radiation — Kd(l) (m-1) All of these vary with respect to geographical location, with time, and with depth, as a result of physical (e.g. solar declination) and biological (e.g. species, adaptation) processes.
0 20 40 60 80 100 0 Percent Surface Irradiance (PAR) 10 Irradiance 20 Depth (m) 30 40 Chlorophyll a 50 0 1 2 3 4 5 Chlorophyll (mg m-3) Modeling primary production To estimate the primary production in the ocean an appropriate model that resolves the important time and space scales of variability is required. It also needs to parameterize the relevant physiological variability in some sense.
Modeling primary productivity Recipe: • Take as input, the local solar flux at the sea-surface, reduced by the albedo. • Propagate in the vertical using the estimated diffuse attenuation coefficient. • Use the resulting local irradiance, and a given P vs E model to estimate the local rate of photosynthesis normalized to the biomass. • Multiply by an assumed biomass profile. • Integrate w.r.t. depth to produce the areal rate. • Integrate w.r.t. time as appropriate. • Integrate w.r.t. to x,y as appropriate. • The largest uncertainty in this is the high degree of physiological variability, as expressed in the parameters of the P vs E curve.
Satellite data of biomass, irradiance and Kd, and models can be used calculate primary productivity globally. marine.rutgers.edu/opp/
Review: The entire marine food chain depends on the rate of primary production of organic matter. For most of the ocean, photosynthetic primary production dominates, and is carried out by the phytoplankton. To first order, the rate of primary production is proportional to the biomass, either measured in carbon or chlorophyll units. Photosynthesis consists of the photolysis of water, and the subsequent reduction of carbon dioxide to form organic matter. Oxygen is produced as a byproduct. Photosynthesis consists of light and dark reactions, and can be measured using the uptake of radioactive carbon dioxide, or the evolution of oxygen. The relationship between primary production and irradiance typically is linear at low light, then saturates, and may be inhibited at high light. The rate of primary production on a local and global scale can be estimated from the solar irradiance, the attenuation of light, the distribution of biomass,and the photosynthesis-irradiance curve, suitably integrated in time and space.